Slavic GED/Equivalency
COMPARE
Slavic
Select to Compare
GED/Equivalency
Slavic GED/Equivalency
87.7%
GED/EQUIVALENCY
98.7/ 100
METRIC RATING
77th/ 347
METRIC RANK
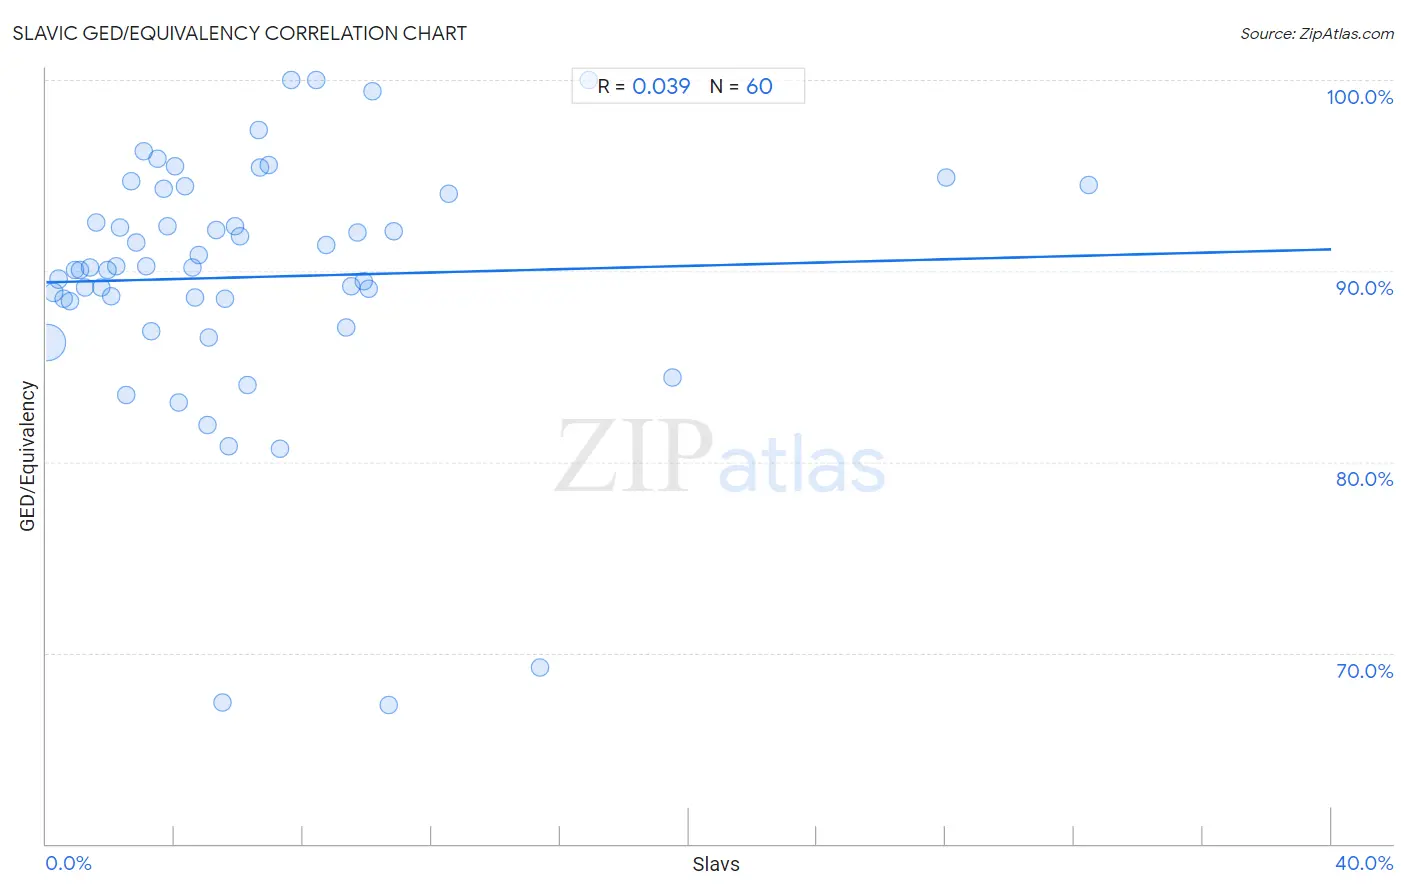
Slavic GED/Equivalency Correlation Chart
The statistical analysis conducted on geographies consisting of 270,868,774 people shows no correlation between the proportion of Slavs and percentage of population with at least ged/equivalency education in the United States with a correlation coefficient (R) of 0.039 and weighted average of 87.7%. On average, for every 1% (one percent) increase in Slavs within a typical geography, there is an increase of 0.043% in percentage of population with at least ged/equivalency education.
It is essential to understand that the correlation between the percentage of Slavs and percentage of population with at least ged/equivalency education does not imply a direct cause-and-effect relationship. It remains uncertain whether the presence of Slavs influences an upward or downward trend in the level of percentage of population with at least ged/equivalency education within an area, or if Slavs simply ended up residing in those areas with higher or lower levels of percentage of population with at least ged/equivalency education due to other factors.
Demographics Similar to Slavs by GED/Equivalency
In terms of ged/equivalency, the demographic groups most similar to Slavs are Immigrants from Serbia (87.7%, a difference of 0.010%), Scottish (87.7%, a difference of 0.020%), Irish (87.6%, a difference of 0.020%), Immigrants from Kuwait (87.7%, a difference of 0.040%), and Belgian (87.7%, a difference of 0.050%).
| Demographics | Rating | Rank | GED/Equivalency |
| Ukrainians | 98.8 /100 | #70 | Exceptional 87.7% |
| Austrians | 98.8 /100 | #71 | Exceptional 87.7% |
| Immigrants from Moldova | 98.8 /100 | #72 | Exceptional 87.7% |
| Belgians | 98.8 /100 | #73 | Exceptional 87.7% |
| Immigrants from Kuwait | 98.8 /100 | #74 | Exceptional 87.7% |
| Scottish | 98.7 /100 | #75 | Exceptional 87.7% |
| Immigrants from Serbia | 98.7 /100 | #76 | Exceptional 87.7% |
| Slavs | 98.7 /100 | #77 | Exceptional 87.7% |
| Irish | 98.6 /100 | #78 | Exceptional 87.6% |
| English | 98.6 /100 | #79 | Exceptional 87.6% |
| Immigrants from England | 98.5 /100 | #80 | Exceptional 87.6% |
| Immigrants from Sri Lanka | 98.3 /100 | #81 | Exceptional 87.5% |
| Romanians | 98.3 /100 | #82 | Exceptional 87.5% |
| South Africans | 98.3 /100 | #83 | Exceptional 87.5% |
| Immigrants from Romania | 98.1 /100 | #84 | Exceptional 87.5% |
Slavic GED/Equivalency Correlation Summary
| Measurement | Slavic Data | GED/Equivalency Data |
| Minimum | 0.050% | 67.2% |
| Maximum | 32.5% | 100.0% |
| Range | 32.4% | 32.8% |
| Mean | 6.3% | 89.7% |
| Median | 4.9% | 90.2% |
| Interquartile 25% (IQ1) | 2.4% | 88.5% |
| Interquartile 75% (IQ3) | 8.6% | 94.2% |
| Interquartile Range (IQR) | 6.2% | 5.7% |
| Standard Deviation (Sample) | 6.1% | 6.7% |
| Standard Deviation (Population) | 6.1% | 6.7% |
Correlation Details
| Slavic Percentile | Sample Size | GED/Equivalency |
[ 0.0% - 0.5% ] 0.050% | 241,118,127 | 86.2% |
[ 0.0% - 0.5% ] 0.22% | 19,817,559 | 88.9% |
[ 0.0% - 0.5% ] 0.39% | 5,286,141 | 89.6% |
[ 0.5% - 1.0% ] 0.56% | 1,950,471 | 88.5% |
[ 0.5% - 1.0% ] 0.73% | 1,071,042 | 88.4% |
[ 0.5% - 1.0% ] 0.89% | 521,179 | 90.0% |
[ 1.0% - 1.5% ] 1.04% | 281,520 | 90.1% |
[ 1.0% - 1.5% ] 1.22% | 266,034 | 89.1% |
[ 1.0% - 1.5% ] 1.36% | 146,866 | 90.2% |
[ 1.5% - 2.0% ] 1.54% | 136,366 | 92.5% |
[ 1.5% - 2.0% ] 1.71% | 42,737 | 89.1% |
[ 1.5% - 2.0% ] 1.89% | 45,605 | 90.1% |
[ 2.0% - 2.5% ] 2.04% | 36,918 | 88.7% |
[ 2.0% - 2.5% ] 2.18% | 20,446 | 90.3% |
[ 2.0% - 2.5% ] 2.31% | 36,891 | 92.3% |
[ 2.0% - 2.5% ] 2.50% | 5,525 | 83.5% |
[ 2.5% - 3.0% ] 2.65% | 5,818 | 94.7% |
[ 2.5% - 3.0% ] 2.82% | 23,398 | 91.5% |
[ 3.0% - 3.5% ] 3.05% | 3,539 | 96.3% |
[ 3.0% - 3.5% ] 3.12% | 12,305 | 90.2% |
[ 3.0% - 3.5% ] 3.28% | 3,108 | 86.8% |
[ 3.0% - 3.5% ] 3.47% | 3,571 | 95.9% |
[ 3.5% - 4.0% ] 3.67% | 3,184 | 94.3% |
[ 3.5% - 4.0% ] 3.77% | 4,404 | 92.3% |
[ 4.0% - 4.5% ] 4.02% | 921 | 95.5% |
[ 4.0% - 4.5% ] 4.14% | 290 | 83.1% |
[ 4.0% - 4.5% ] 4.32% | 672 | 94.5% |
[ 4.5% - 5.0% ] 4.54% | 2,910 | 90.2% |
[ 4.5% - 5.0% ] 4.63% | 691 | 88.6% |
[ 4.5% - 5.0% ] 4.74% | 2,804 | 90.9% |
[ 5.0% - 5.5% ] 5.00% | 200 | 81.9% |
[ 5.0% - 5.5% ] 5.05% | 970 | 86.5% |
[ 5.0% - 5.5% ] 5.28% | 2,536 | 92.2% |
[ 5.0% - 5.5% ] 5.48% | 420 | 67.4% |
[ 5.5% - 6.0% ] 5.55% | 595 | 88.5% |
[ 5.5% - 6.0% ] 5.69% | 686 | 80.8% |
[ 5.5% - 6.0% ] 5.89% | 526 | 92.4% |
[ 6.0% - 6.5% ] 6.02% | 498 | 91.8% |
[ 6.0% - 6.5% ] 6.25% | 304 | 84.1% |
[ 6.5% - 7.0% ] 6.62% | 665 | 97.3% |
[ 6.5% - 7.0% ] 6.67% | 150 | 95.4% |
[ 6.5% - 7.0% ] 6.94% | 2,493 | 95.5% |
[ 7.0% - 7.5% ] 7.29% | 768 | 80.7% |
[ 7.5% - 8.0% ] 7.61% | 197 | 100.0% |
[ 8.0% - 8.5% ] 8.42% | 95 | 100.0% |
[ 8.5% - 9.0% ] 8.72% | 149 | 91.4% |
[ 9.0% - 9.5% ] 9.35% | 1,251 | 87.0% |
[ 9.0% - 9.5% ] 9.48% | 306 | 89.2% |
[ 9.5% - 10.0% ] 9.69% | 949 | 92.0% |
[ 9.5% - 10.0% ] 9.87% | 223 | 89.5% |
[ 10.0% - 10.5% ] 10.03% | 309 | 89.1% |
[ 10.0% - 10.5% ] 10.14% | 365 | 99.4% |
[ 10.5% - 11.0% ] 10.67% | 75 | 67.2% |
[ 10.5% - 11.0% ] 10.83% | 120 | 92.1% |
[ 12.5% - 13.0% ] 12.55% | 526 | 94.0% |
[ 15.0% - 15.5% ] 15.38% | 39 | 69.2% |
[ 16.5% - 17.0% ] 16.88% | 154 | 100.0% |
[ 19.0% - 19.5% ] 19.50% | 995 | 84.4% |
[ 28.0% - 28.5% ] 28.02% | 746 | 94.9% |
[ 32.0% - 32.5% ] 32.46% | 422 | 94.5% |