Slavic Self-Care Disability
COMPARE
Slavic
Select to Compare
Self-Care Disability
Slavic Self-Care Disability
2.5%
SELF-CARE DISABILITY
34.3/ 100
METRIC RATING
185th/ 347
METRIC RANK
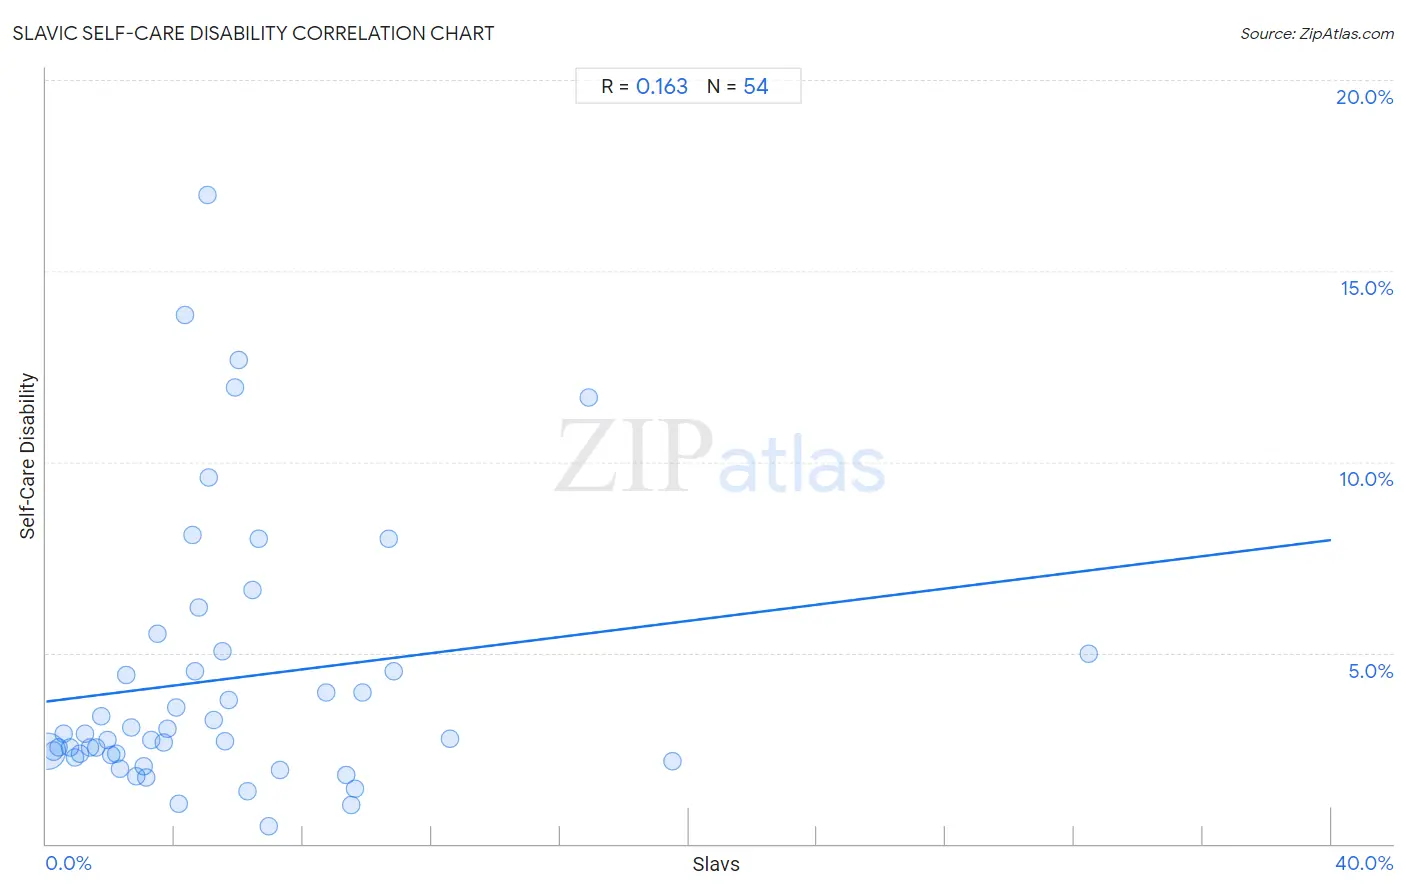
Slavic Self-Care Disability Correlation Chart
The statistical analysis conducted on geographies consisting of 270,712,233 people shows a poor positive correlation between the proportion of Slavs and percentage of population with self-care disability in the United States with a correlation coefficient (R) of 0.163 and weighted average of 2.5%. On average, for every 1% (one percent) increase in Slavs within a typical geography, there is an increase of 0.11% in percentage of population with self-care disability.
It is essential to understand that the correlation between the percentage of Slavs and percentage of population with self-care disability does not imply a direct cause-and-effect relationship. It remains uncertain whether the presence of Slavs influences an upward or downward trend in the level of percentage of population with self-care disability within an area, or if Slavs simply ended up residing in those areas with higher or lower levels of percentage of population with self-care disability due to other factors.
Demographics Similar to Slavs by Self-Care Disability
In terms of self-care disability, the demographic groups most similar to Slavs are Immigrants from El Salvador (2.5%, a difference of 0.070%), Yugoslavian (2.5%, a difference of 0.090%), Salvadoran (2.5%, a difference of 0.11%), Maltese (2.5%, a difference of 0.16%), and Ghanaian (2.5%, a difference of 0.31%).
| Demographics | Rating | Rank | Self-Care Disability |
| English | 46.2 /100 | #178 | Average 2.5% |
| Hungarians | 45.5 /100 | #179 | Average 2.5% |
| Indonesians | 41.2 /100 | #180 | Average 2.5% |
| Ghanaians | 40.4 /100 | #181 | Average 2.5% |
| Maltese | 37.5 /100 | #182 | Fair 2.5% |
| Salvadorans | 36.4 /100 | #183 | Fair 2.5% |
| Yugoslavians | 36.1 /100 | #184 | Fair 2.5% |
| Slavs | 34.3 /100 | #185 | Fair 2.5% |
| Immigrants from El Salvador | 33.0 /100 | #186 | Fair 2.5% |
| Irish | 28.7 /100 | #187 | Fair 2.5% |
| Immigrants from Oceania | 28.3 /100 | #188 | Fair 2.5% |
| Immigrants from Eastern Europe | 28.0 /100 | #189 | Fair 2.5% |
| Sioux | 24.6 /100 | #190 | Fair 2.5% |
| Moroccans | 22.9 /100 | #191 | Fair 2.5% |
| Soviet Union | 22.2 /100 | #192 | Fair 2.5% |
Slavic Self-Care Disability Correlation Summary
| Measurement | Slavic Data | Self-Care Disability Data |
| Minimum | 0.050% | 0.47% |
| Maximum | 32.5% | 17.0% |
| Range | 32.4% | 16.5% |
| Mean | 5.6% | 4.3% |
| Median | 4.4% | 2.8% |
| Interquartile 25% (IQ1) | 2.2% | 2.3% |
| Interquartile 75% (IQ3) | 6.6% | 5.0% |
| Interquartile Range (IQR) | 4.4% | 2.6% |
| Standard Deviation (Sample) | 5.5% | 3.6% |
| Standard Deviation (Population) | 5.4% | 3.5% |
Correlation Details
| Slavic Percentile | Sample Size | Self-Care Disability |
[ 0.0% - 0.5% ] 0.050% | 241,065,894 | 2.4% |
[ 0.0% - 0.5% ] 0.22% | 19,779,529 | 2.4% |
[ 0.0% - 0.5% ] 0.39% | 5,271,550 | 2.5% |
[ 0.5% - 1.0% ] 0.56% | 1,932,830 | 2.9% |
[ 0.5% - 1.0% ] 0.73% | 1,063,538 | 2.5% |
[ 0.5% - 1.0% ] 0.89% | 515,909 | 2.3% |
[ 1.0% - 1.5% ] 1.04% | 280,513 | 2.3% |
[ 1.0% - 1.5% ] 1.22% | 264,119 | 2.9% |
[ 1.0% - 1.5% ] 1.36% | 145,069 | 2.5% |
[ 1.5% - 2.0% ] 1.54% | 135,689 | 2.5% |
[ 1.5% - 2.0% ] 1.71% | 38,929 | 3.3% |
[ 1.5% - 2.0% ] 1.89% | 45,605 | 2.7% |
[ 2.0% - 2.5% ] 2.03% | 33,794 | 2.3% |
[ 2.0% - 2.5% ] 2.17% | 17,166 | 2.3% |
[ 2.0% - 2.5% ] 2.31% | 36,594 | 2.0% |
[ 2.5% - 3.0% ] 2.50% | 5,199 | 4.4% |
[ 2.5% - 3.0% ] 2.65% | 5,818 | 3.1% |
[ 2.5% - 3.0% ] 2.82% | 23,398 | 1.8% |
[ 3.0% - 3.5% ] 3.05% | 3,539 | 2.0% |
[ 3.0% - 3.5% ] 3.12% | 12,305 | 1.7% |
[ 3.0% - 3.5% ] 3.28% | 2,686 | 2.7% |
[ 3.0% - 3.5% ] 3.47% | 3,571 | 5.5% |
[ 3.5% - 4.0% ] 3.67% | 3,184 | 2.6% |
[ 3.5% - 4.0% ] 3.77% | 4,404 | 3.0% |
[ 4.0% - 4.5% ] 4.06% | 419 | 3.6% |
[ 4.0% - 4.5% ] 4.14% | 290 | 1.0% |
[ 4.0% - 4.5% ] 4.32% | 672 | 13.8% |
[ 4.5% - 5.0% ] 4.54% | 2,910 | 8.1% |
[ 4.5% - 5.0% ] 4.63% | 691 | 4.5% |
[ 4.5% - 5.0% ] 4.74% | 2,804 | 6.2% |
[ 5.0% - 5.5% ] 5.00% | 200 | 17.0% |
[ 5.0% - 5.5% ] 5.05% | 970 | 9.6% |
[ 5.0% - 5.5% ] 5.20% | 1,000 | 3.2% |
[ 5.0% - 5.5% ] 5.48% | 420 | 5.0% |
[ 5.5% - 6.0% ] 5.55% | 595 | 2.7% |
[ 5.5% - 6.0% ] 5.69% | 686 | 3.8% |
[ 5.5% - 6.0% ] 5.89% | 526 | 12.0% |
[ 6.0% - 6.5% ] 6.01% | 366 | 12.7% |
[ 6.0% - 6.5% ] 6.28% | 223 | 1.4% |
[ 6.0% - 6.5% ] 6.41% | 702 | 6.6% |
[ 6.5% - 7.0% ] 6.62% | 665 | 8.0% |
[ 6.5% - 7.0% ] 6.94% | 2,493 | 0.47% |
[ 7.0% - 7.5% ] 7.29% | 768 | 1.9% |
[ 8.5% - 9.0% ] 8.72% | 149 | 4.0% |
[ 9.0% - 9.5% ] 9.35% | 1,251 | 1.8% |
[ 9.0% - 9.5% ] 9.48% | 306 | 1.0% |
[ 9.5% - 10.0% ] 9.62% | 291 | 1.4% |
[ 9.5% - 10.0% ] 9.85% | 132 | 4.0% |
[ 10.5% - 11.0% ] 10.67% | 75 | 8.0% |
[ 10.5% - 11.0% ] 10.83% | 120 | 4.5% |
[ 12.5% - 13.0% ] 12.56% | 398 | 2.8% |
[ 16.5% - 17.0% ] 16.88% | 154 | 11.7% |
[ 19.0% - 19.5% ] 19.49% | 703 | 2.2% |
[ 32.0% - 32.5% ] 32.46% | 422 | 5.0% |