Slavic Disability
COMPARE
Slavic
Select to Compare
Disability
Slavic Disability
12.4%
DISABILITY
0.5/ 100
METRIC RATING
258th/ 347
METRIC RANK
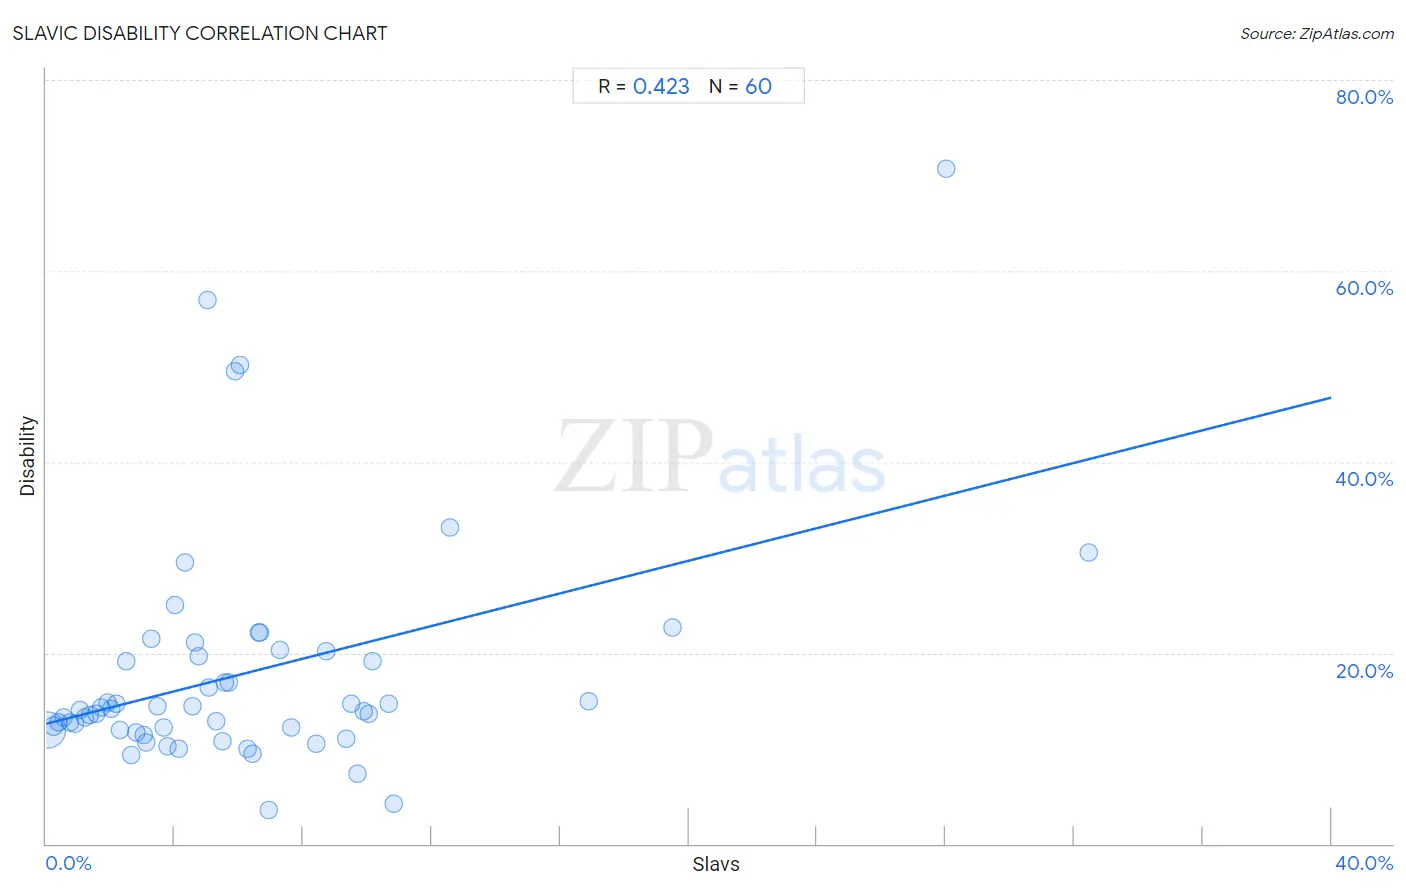
Slavic Disability Correlation Chart
The statistical analysis conducted on geographies consisting of 270,861,742 people shows a moderate positive correlation between the proportion of Slavs and percentage of population with a disability in the United States with a correlation coefficient (R) of 0.423 and weighted average of 12.4%. On average, for every 1% (one percent) increase in Slavs within a typical geography, there is an increase of 0.85% in percentage of population with a disability.
It is essential to understand that the correlation between the percentage of Slavs and percentage of population with a disability does not imply a direct cause-and-effect relationship. It remains uncertain whether the presence of Slavs influences an upward or downward trend in the level of percentage of population with a disability within an area, or if Slavs simply ended up residing in those areas with higher or lower levels of percentage of population with a disability due to other factors.
Demographics Similar to Slavs by Disability
In terms of disability, the demographic groups most similar to Slavs are Canadian (12.4%, a difference of 0.060%), Immigrants from Liberia (12.4%, a difference of 0.090%), Immigrants from Laos (12.4%, a difference of 0.14%), Scandinavian (12.4%, a difference of 0.16%), and Immigrants from Dominica (12.4%, a difference of 0.23%).
| Demographics | Rating | Rank | Disability |
| Europeans | 1.4 /100 | #251 | Tragic 12.3% |
| Bermudans | 1.1 /100 | #252 | Tragic 12.3% |
| Belgians | 0.8 /100 | #253 | Tragic 12.3% |
| German Russians | 0.8 /100 | #254 | Tragic 12.3% |
| Slovenes | 0.6 /100 | #255 | Tragic 12.4% |
| Immigrants from Dominica | 0.6 /100 | #256 | Tragic 12.4% |
| Immigrants from Laos | 0.5 /100 | #257 | Tragic 12.4% |
| Slavs | 0.5 /100 | #258 | Tragic 12.4% |
| Canadians | 0.4 /100 | #259 | Tragic 12.4% |
| Immigrants from Liberia | 0.4 /100 | #260 | Tragic 12.4% |
| Scandinavians | 0.4 /100 | #261 | Tragic 12.4% |
| Native Hawaiians | 0.3 /100 | #262 | Tragic 12.5% |
| Hawaiians | 0.2 /100 | #263 | Tragic 12.5% |
| Immigrants from Germany | 0.2 /100 | #264 | Tragic 12.5% |
| U.S. Virgin Islanders | 0.2 /100 | #265 | Tragic 12.5% |
Slavic Disability Correlation Summary
| Measurement | Slavic Data | Disability Data |
| Minimum | 0.050% | 3.5% |
| Maximum | 32.5% | 70.6% |
| Range | 32.4% | 67.1% |
| Mean | 6.2% | 17.8% |
| Median | 4.9% | 14.0% |
| Interquartile 25% (IQ1) | 2.4% | 11.9% |
| Interquartile 75% (IQ3) | 8.0% | 19.9% |
| Interquartile Range (IQR) | 5.6% | 7.9% |
| Standard Deviation (Sample) | 6.0% | 12.1% |
| Standard Deviation (Population) | 5.9% | 12.0% |
Correlation Details
| Slavic Percentile | Sample Size | Disability |
[ 0.0% - 0.5% ] 0.050% | 241,113,022 | 11.9% |
[ 0.0% - 0.5% ] 0.22% | 19,819,961 | 12.3% |
[ 0.0% - 0.5% ] 0.39% | 5,286,141 | 12.7% |
[ 0.5% - 1.0% ] 0.56% | 1,947,742 | 13.3% |
[ 0.5% - 1.0% ] 0.73% | 1,069,144 | 12.7% |
[ 0.5% - 1.0% ] 0.89% | 521,179 | 12.6% |
[ 1.0% - 1.5% ] 1.04% | 281,520 | 14.0% |
[ 1.0% - 1.5% ] 1.22% | 266,034 | 13.3% |
[ 1.0% - 1.5% ] 1.36% | 146,866 | 13.5% |
[ 1.5% - 2.0% ] 1.54% | 136,366 | 13.7% |
[ 1.5% - 2.0% ] 1.71% | 42,737 | 14.2% |
[ 1.5% - 2.0% ] 1.89% | 45,605 | 14.8% |
[ 2.0% - 2.5% ] 2.04% | 36,918 | 14.1% |
[ 2.0% - 2.5% ] 2.18% | 20,446 | 14.7% |
[ 2.0% - 2.5% ] 2.31% | 36,891 | 12.0% |
[ 2.0% - 2.5% ] 2.50% | 5,525 | 19.1% |
[ 2.5% - 3.0% ] 2.65% | 5,818 | 9.3% |
[ 2.5% - 3.0% ] 2.82% | 23,398 | 11.6% |
[ 3.0% - 3.5% ] 3.05% | 3,539 | 11.4% |
[ 3.0% - 3.5% ] 3.12% | 12,305 | 10.5% |
[ 3.0% - 3.5% ] 3.28% | 2,807 | 21.5% |
[ 3.0% - 3.5% ] 3.47% | 3,571 | 14.3% |
[ 3.5% - 4.0% ] 3.67% | 3,184 | 12.2% |
[ 3.5% - 4.0% ] 3.77% | 4,404 | 10.3% |
[ 4.0% - 4.5% ] 4.02% | 921 | 25.0% |
[ 4.0% - 4.5% ] 4.14% | 290 | 10.0% |
[ 4.0% - 4.5% ] 4.32% | 672 | 29.5% |
[ 4.5% - 5.0% ] 4.54% | 2,910 | 14.5% |
[ 4.5% - 5.0% ] 4.63% | 691 | 21.1% |
[ 4.5% - 5.0% ] 4.74% | 2,804 | 19.6% |
[ 5.0% - 5.5% ] 5.00% | 200 | 57.0% |
[ 5.0% - 5.5% ] 5.05% | 970 | 16.4% |
[ 5.0% - 5.5% ] 5.28% | 2,536 | 12.9% |
[ 5.0% - 5.5% ] 5.48% | 420 | 10.7% |
[ 5.5% - 6.0% ] 5.55% | 595 | 16.9% |
[ 5.5% - 6.0% ] 5.69% | 686 | 16.9% |
[ 5.5% - 6.0% ] 5.89% | 526 | 49.5% |
[ 6.0% - 6.5% ] 6.02% | 498 | 50.2% |
[ 6.0% - 6.5% ] 6.25% | 304 | 10.0% |
[ 6.0% - 6.5% ] 6.41% | 702 | 9.4% |
[ 6.5% - 7.0% ] 6.62% | 665 | 22.1% |
[ 6.5% - 7.0% ] 6.67% | 150 | 22.1% |
[ 6.5% - 7.0% ] 6.94% | 2,493 | 3.5% |
[ 7.0% - 7.5% ] 7.29% | 768 | 20.3% |
[ 7.5% - 8.0% ] 7.61% | 197 | 12.2% |
[ 8.0% - 8.5% ] 8.42% | 95 | 10.5% |
[ 8.5% - 9.0% ] 8.72% | 149 | 20.1% |
[ 9.0% - 9.5% ] 9.35% | 1,251 | 11.0% |
[ 9.0% - 9.5% ] 9.48% | 306 | 14.7% |
[ 9.5% - 10.0% ] 9.69% | 949 | 7.3% |
[ 9.5% - 10.0% ] 9.87% | 223 | 13.9% |
[ 10.0% - 10.5% ] 10.03% | 309 | 13.6% |
[ 10.0% - 10.5% ] 10.14% | 365 | 19.2% |
[ 10.5% - 11.0% ] 10.67% | 75 | 14.7% |
[ 10.5% - 11.0% ] 10.83% | 120 | 4.2% |
[ 12.5% - 13.0% ] 12.55% | 462 | 33.1% |
[ 16.5% - 17.0% ] 16.88% | 154 | 14.9% |
[ 19.0% - 19.5% ] 19.50% | 995 | 22.7% |
[ 28.0% - 28.5% ] 28.02% | 746 | 70.6% |
[ 32.0% - 32.5% ] 32.46% | 422 | 30.6% |