Slavic 4 or more Vehicles in Household
COMPARE
Slavic
Select to Compare
4 or more Vehicles in Household
Slavic 4 or more Vehicles in Household
6.6%
4+ VEHICLES AVAILABLE
81.6/ 100
METRIC RATING
140th/ 347
METRIC RANK
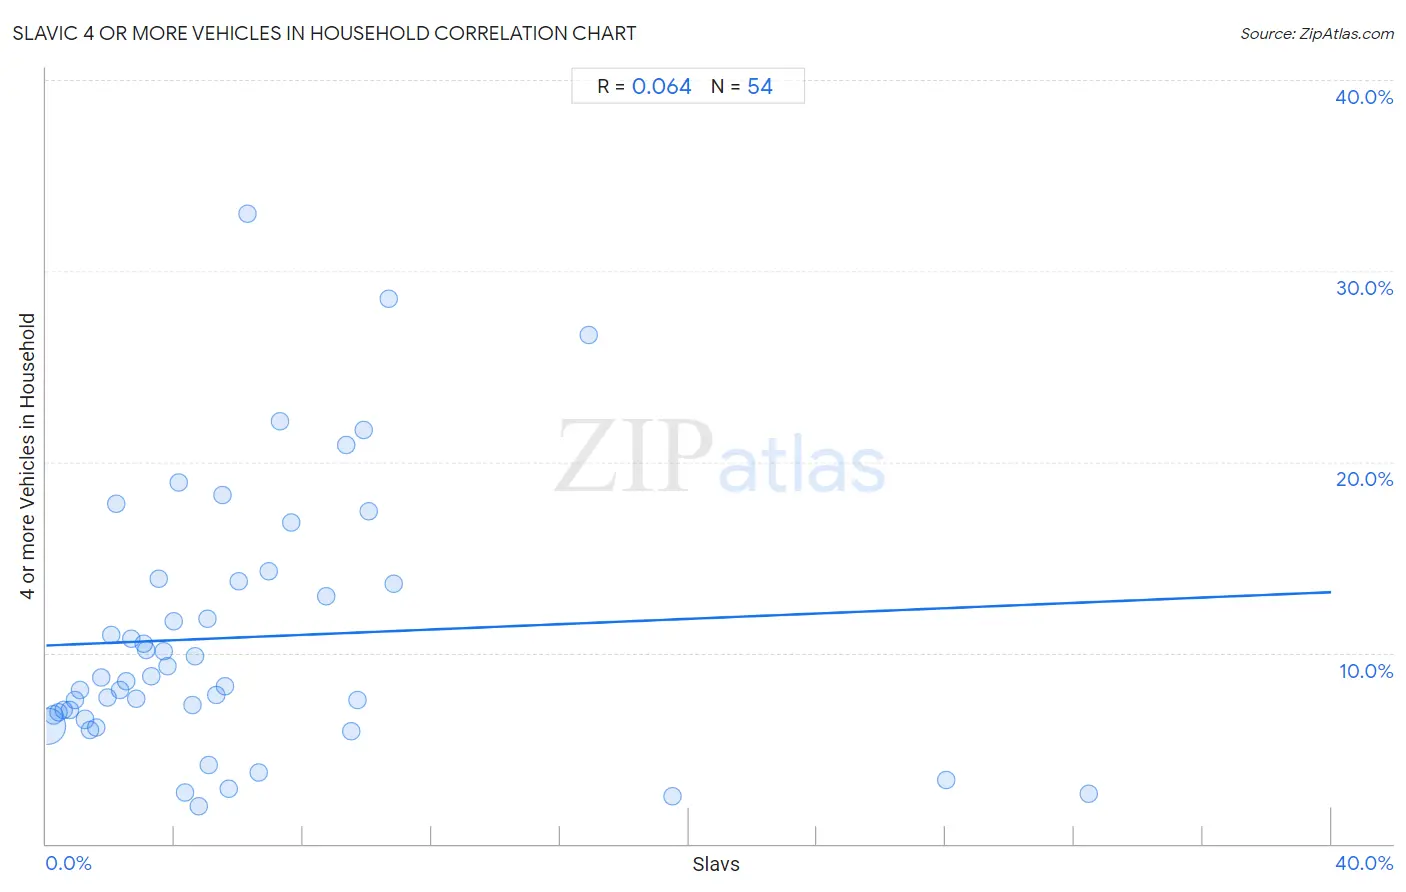
Slavic 4 or more Vehicles in Household Correlation Chart
The statistical analysis conducted on geographies consisting of 270,086,100 people shows a slight positive correlation between the proportion of Slavs and percentage of households with 4 or more vehicles available in the United States with a correlation coefficient (R) of 0.064 and weighted average of 6.6%. On average, for every 1% (one percent) increase in Slavs within a typical geography, there is an increase of 0.070% in percentage of households with 4 or more vehicles available.
It is essential to understand that the correlation between the percentage of Slavs and percentage of households with 4 or more vehicles available does not imply a direct cause-and-effect relationship. It remains uncertain whether the presence of Slavs influences an upward or downward trend in the level of percentage of households with 4 or more vehicles available within an area, or if Slavs simply ended up residing in those areas with higher or lower levels of percentage of households with 4 or more vehicles available due to other factors.
Demographics Similar to Slavs by 4 or more Vehicles in Household
In terms of 4 or more vehicles in household, the demographic groups most similar to Slavs are Jordanian (6.6%, a difference of 0.080%), Australian (6.6%, a difference of 0.13%), Immigrants from Iraq (6.5%, a difference of 0.33%), Immigrants from Canada (6.5%, a difference of 0.46%), and Immigrants from North America (6.5%, a difference of 0.48%).
| Demographics | Rating | Rank | 4 or more Vehicles in Household |
| Armenians | 86.9 /100 | #133 | Excellent 6.6% |
| Ottawa | 86.9 /100 | #134 | Excellent 6.6% |
| Tohono O'odham | 86.7 /100 | #135 | Excellent 6.6% |
| Luxembourgers | 86.4 /100 | #136 | Excellent 6.6% |
| French Canadians | 85.4 /100 | #137 | Excellent 6.6% |
| Italians | 84.5 /100 | #138 | Excellent 6.6% |
| Jordanians | 82.1 /100 | #139 | Excellent 6.6% |
| Slavs | 81.6 /100 | #140 | Excellent 6.6% |
| Australians | 80.8 /100 | #141 | Excellent 6.6% |
| Immigrants from Iraq | 79.4 /100 | #142 | Good 6.5% |
| Immigrants from Canada | 78.6 /100 | #143 | Good 6.5% |
| Immigrants from North America | 78.5 /100 | #144 | Good 6.5% |
| Croatians | 77.8 /100 | #145 | Good 6.5% |
| Immigrants from Costa Rica | 74.4 /100 | #146 | Good 6.5% |
| Immigrants from Iran | 73.9 /100 | #147 | Good 6.5% |
Slavic 4 or more Vehicles in Household Correlation Summary
| Measurement | Slavic Data | 4 or more Vehicles in Household Data |
| Minimum | 0.050% | 2.0% |
| Maximum | 32.5% | 33.0% |
| Range | 32.4% | 31.0% |
| Mean | 5.9% | 10.8% |
| Median | 4.4% | 8.6% |
| Interquartile 25% (IQ1) | 2.2% | 6.7% |
| Interquartile 75% (IQ3) | 7.3% | 13.7% |
| Interquartile Range (IQR) | 5.1% | 7.0% |
| Standard Deviation (Sample) | 6.2% | 6.8% |
| Standard Deviation (Population) | 6.2% | 6.8% |
Correlation Details
| Slavic Percentile | Sample Size | 4 or more Vehicles in Household |
[ 0.0% - 0.5% ] 0.050% | 240,567,090 | 6.1% |
[ 0.0% - 0.5% ] 0.22% | 19,645,916 | 6.7% |
[ 0.0% - 0.5% ] 0.39% | 5,267,080 | 6.9% |
[ 0.5% - 1.0% ] 0.56% | 1,934,258 | 7.0% |
[ 0.5% - 1.0% ] 0.73% | 1,065,279 | 7.0% |
[ 0.5% - 1.0% ] 0.89% | 519,695 | 7.5% |
[ 1.0% - 1.5% ] 1.04% | 280,156 | 8.1% |
[ 1.0% - 1.5% ] 1.22% | 263,854 | 6.5% |
[ 1.0% - 1.5% ] 1.36% | 145,278 | 5.9% |
[ 1.5% - 2.0% ] 1.55% | 133,431 | 6.1% |
[ 1.5% - 2.0% ] 1.71% | 42,450 | 8.7% |
[ 1.5% - 2.0% ] 1.89% | 45,442 | 7.6% |
[ 2.0% - 2.5% ] 2.04% | 36,769 | 10.9% |
[ 2.0% - 2.5% ] 2.17% | 18,899 | 17.8% |
[ 2.0% - 2.5% ] 2.31% | 36,594 | 8.1% |
[ 2.5% - 3.0% ] 2.50% | 4,673 | 8.5% |
[ 2.5% - 3.0% ] 2.65% | 5,818 | 10.7% |
[ 2.5% - 3.0% ] 2.82% | 23,222 | 7.6% |
[ 3.0% - 3.5% ] 3.05% | 3,539 | 10.5% |
[ 3.0% - 3.5% ] 3.12% | 12,150 | 10.2% |
[ 3.0% - 3.5% ] 3.28% | 2,591 | 8.8% |
[ 3.5% - 4.0% ] 3.52% | 1,678 | 13.9% |
[ 3.5% - 4.0% ] 3.67% | 3,184 | 10.1% |
[ 3.5% - 4.0% ] 3.77% | 4,404 | 9.3% |
[ 3.5% - 4.0% ] 3.98% | 502 | 11.7% |
[ 4.0% - 4.5% ] 4.14% | 290 | 18.9% |
[ 4.0% - 4.5% ] 4.32% | 672 | 2.7% |
[ 4.5% - 5.0% ] 4.54% | 2,910 | 7.2% |
[ 4.5% - 5.0% ] 4.63% | 691 | 9.8% |
[ 4.5% - 5.0% ] 4.74% | 2,194 | 2.0% |
[ 5.0% - 5.5% ] 5.00% | 200 | 11.8% |
[ 5.0% - 5.5% ] 5.05% | 970 | 4.1% |
[ 5.0% - 5.5% ] 5.28% | 2,536 | 7.8% |
[ 5.0% - 5.5% ] 5.48% | 420 | 18.2% |
[ 5.5% - 6.0% ] 5.55% | 595 | 8.3% |
[ 5.5% - 6.0% ] 5.69% | 686 | 2.9% |
[ 6.0% - 6.5% ] 6.00% | 150 | 13.7% |
[ 6.0% - 6.5% ] 6.25% | 304 | 33.0% |
[ 6.5% - 7.0% ] 6.62% | 665 | 3.7% |
[ 6.5% - 7.0% ] 6.94% | 2,493 | 14.3% |
[ 7.0% - 7.5% ] 7.29% | 768 | 22.1% |
[ 7.5% - 8.0% ] 7.61% | 197 | 16.8% |
[ 8.5% - 9.0% ] 8.72% | 149 | 13.0% |
[ 9.0% - 9.5% ] 9.35% | 1,251 | 20.9% |
[ 9.0% - 9.5% ] 9.48% | 306 | 5.9% |
[ 9.5% - 10.0% ] 9.69% | 949 | 7.5% |
[ 9.5% - 10.0% ] 9.87% | 223 | 21.7% |
[ 10.0% - 10.5% ] 10.03% | 309 | 17.4% |
[ 10.5% - 11.0% ] 10.67% | 75 | 28.6% |
[ 10.5% - 11.0% ] 10.83% | 120 | 13.6% |
[ 16.5% - 17.0% ] 16.88% | 154 | 26.7% |
[ 19.0% - 19.5% ] 19.49% | 703 | 2.5% |
[ 28.0% - 28.5% ] 28.02% | 746 | 3.3% |
[ 32.0% - 32.5% ] 32.46% | 422 | 2.6% |