Russian Married-Couple Family Poverty

COMPARE

Russian
Race
Ancestry
AfghanAfricanAlaska NativeAlaskan AthabascanAlbanianAleutAlsatianAmericanApacheArabArapahoArgentineanArmenianAssyrian/Chaldean/SyriacAustralianAustrianBahamianBangladeshiBarbadianBasqueBelgianBelizeanBermudanBhutaneseBlackfeetBolivianBrazilianBritishBritish West IndianBulgarianBurmeseCajunCambodianCanadianCape VerdeanCarpatho RusynCelticCentral AmericanCentral American IndianCherokeeCheyenneChickasawChileanChineseChippewaChoctawColombianColvilleComancheCosta RicanCreeCreekCroatianCrowCubanCypriotCzechCzechoslovakianDanishDelawareDominicanDutchDutch West IndianEastern EuropeanEcuadorianEgyptianEnglishEstonianEthiopianEuropeanFijianFilipinoFinnishFrenchFrench American IndianFrench CanadianGermanGerman RussianGhanaianGreekGuamanian/ChamorroGuatemalanGuyaneseHaitianHmongHonduranHopiHoumaHungarianIcelanderIndian (Asian)IndonesianInupiatIranianIraqiIrishIroquoisIsraeliItalianJamaicanJapaneseJordanianKenyanKiowaKoreanLaotianLatvianLebaneseLiberianLithuanianLumbeeLuxembourgerMacedonianMalaysianMalteseMarshalleseMenomineeMexicanMexican American IndianMongolianMoroccanNative HawaiianNavajoNepaleseNew ZealanderNicaraguanNigerianNorthern EuropeanNorwegianOkinawanOsageOttawaPaiutePakistaniPalestinianPanamanianParaguayanPennsylvania GermanPeruvianPimaPolishPortuguesePotawatomiPuebloPuerto RicanPuget Sound SalishRomanianRussianSalvadoranSamoanScandinavianScotch-IrishScottishSeminoleSenegaleseSerbianShoshoneSierra LeoneanSiouxSlavicSlovakSloveneSomaliSouth AfricanSouth AmericanSouth American IndianSoviet UnionSpaniardSpanishSpanish AmericanSpanish American IndianSri LankanSubsaharan AfricanSudaneseSwedishSwissSyrianTaiwaneseThaiTlingit-HaidaTohono O'OdhamTonganTrinidadian and TobagonianTsimshianTurkishU.S. Virgin IslanderUgandanUkrainianUruguayanUteVenezuelanVietnameseWelshWest IndianYakamaYaquiYugoslavianYumanYup'ikZimbabwean
Immigration
NonimmigrantsImmigrantsAfghanistanAfricaAlbaniaArgentinaArmeniaAsiaAustraliaAustriaBahamasBangladeshBarbadosBelarusBelgiumBelizeBoliviaBosnia and HerzegovinaBrazilBulgariaBurma/MyanmarCabo VerdeCambodiaCameroonCanadaCaribbeanCentral AmericaChileChinaColombiaCongoCosta RicaCroatiaCubaCzechoslovakiaDenmarkDominicaDominican RepublicEastern AfricaEastern AsiaEastern EuropeEcuadorEgyptEl SalvadorEnglandEritreaEthiopiaEuropeFijiFranceGermanyGhanaGreeceGrenadaGuatemalaGuyanaHaitiHondurasHong KongHungaryIndiaIndonesiaIranIraqIrelandIsraelItalyJamaicaJapanJordanKazakhstanKenyaKoreaKuwaitLaosLatin AmericaLatviaLebanonLiberiaLithuaniaMalaysiaMexicoMicronesiaMiddle AfricaMoldovaMoroccoNepalNetherlandsNicaraguaNigeriaNorth AmericaNorth MacedoniaNorthern AfricaNorthern EuropeNorwayOceaniaPakistanPanamaPeruPhilippinesPolandPortugalRomaniaRussiaSaudi ArabiaScotlandSenegalSerbiaSierra LeoneSingaporeSomaliaSouth AfricaSouth AmericaSouth Central AsiaSouth Eastern AsiaSouthern EuropeSpainSri LankaSt. Vincent and the GrenadinesSudanSwedenSwitzerlandSyriaTaiwanThailandTrinidad and TobagoTurkeyUgandaUkraineUruguayUzbekistanVenezuelaVietnamWest IndiesWestern AfricaWestern AsiaWestern EuropeYemenZaireZimbabweAzores
Select to Compare
Race
Ancestry
AfghanAfricanAlaska NativeAlaskan AthabascanAlbanianAleutAlsatianAmericanApacheArabArapahoArgentineanArmenianAssyrian/Chaldean/SyriacAustralianAustrianBahamianBangladeshiBarbadianBasqueBelgianBelizeanBermudanBhutaneseBlackfeetBolivianBrazilianBritishBritish West IndianBulgarianBurmeseCajunCambodianCanadianCape VerdeanCarpatho RusynCelticCentral AmericanCentral American IndianCherokeeCheyenneChickasawChileanChineseChippewaChoctawColombianColvilleComancheCosta RicanCreeCreekCroatianCrowCubanCypriotCzechCzechoslovakianDanishDelawareDominicanDutchDutch West IndianEastern EuropeanEcuadorianEgyptianEnglishEstonianEthiopianEuropeanFijianFilipinoFinnishFrenchFrench American IndianFrench CanadianGermanGerman RussianGhanaianGreekGuamanian/ChamorroGuatemalanGuyaneseHaitianHmongHonduranHopiHoumaHungarianIcelanderIndian (Asian)IndonesianInupiatIranianIraqiIrishIroquoisIsraeliItalianJamaicanJapaneseJordanianKenyanKiowaKoreanLaotianLatvianLebaneseLiberianLithuanianLumbeeLuxembourgerMacedonianMalaysianMalteseMarshalleseMenomineeMexicanMexican American IndianMongolianMoroccanNative HawaiianNavajoNepaleseNew ZealanderNicaraguanNigerianNorthern EuropeanNorwegianOkinawanOsageOttawaPaiutePakistaniPalestinianPanamanianParaguayanPennsylvania GermanPeruvianPimaPolishPortuguesePotawatomiPuebloPuerto RicanPuget Sound SalishRomanianSalvadoranSamoanScandinavianScotch-IrishScottishSeminoleSenegaleseSerbianShoshoneSierra LeoneanSiouxSlavicSlovakSloveneSomaliSouth AfricanSouth AmericanSouth American IndianSoviet UnionSpaniardSpanishSpanish AmericanSpanish American IndianSri LankanSubsaharan AfricanSudaneseSwedishSwissSyrianTaiwaneseThaiTlingit-HaidaTohono O'OdhamTonganTrinidadian and TobagonianTsimshianTurkishU.S. Virgin IslanderUgandanUkrainianUruguayanUteVenezuelanVietnameseWelshWest IndianYakamaYaquiYugoslavianYumanYup'ikZimbabwean
Immigration
NonimmigrantsImmigrantsAfghanistanAfricaAlbaniaArgentinaArmeniaAsiaAustraliaAustriaBahamasBangladeshBarbadosBelarusBelgiumBelizeBoliviaBosnia and HerzegovinaBrazilBulgariaBurma/MyanmarCabo VerdeCambodiaCameroonCanadaCaribbeanCentral AmericaChileChinaColombiaCongoCosta RicaCroatiaCubaCzechoslovakiaDenmarkDominicaDominican RepublicEastern AfricaEastern AsiaEastern EuropeEcuadorEgyptEl SalvadorEnglandEritreaEthiopiaEuropeFijiFranceGermanyGhanaGreeceGrenadaGuatemalaGuyanaHaitiHondurasHong KongHungaryIndiaIndonesiaIranIraqIrelandIsraelItalyJamaicaJapanJordanKazakhstanKenyaKoreaKuwaitLaosLatin AmericaLatviaLebanonLiberiaLithuaniaMalaysiaMexicoMicronesiaMiddle AfricaMoldovaMoroccoNepalNetherlandsNicaraguaNigeriaNorth AmericaNorth MacedoniaNorthern AfricaNorthern EuropeNorwayOceaniaPakistanPanamaPeruPhilippinesPolandPortugalRomaniaRussiaSaudi ArabiaScotlandSenegalSerbiaSierra LeoneSingaporeSomaliaSouth AfricaSouth AmericaSouth Central AsiaSouth Eastern AsiaSouthern EuropeSpainSri LankaSt. Vincent and the GrenadinesSudanSwedenSwitzerlandSyriaTaiwanThailandTrinidad and TobagoTurkeyUgandaUkraineUruguayUzbekistanVenezuelaVietnamWest IndiesWestern AfricaWestern AsiaWestern EuropeYemenZaireZimbabweAzores
Married-Couple Family Poverty
Income
Poverty
Unemployment
Labor Participation
Family Structure
Vehicle Availability
Education Level
Disability

Russian Married-Couple Family Poverty
Exceptional

4.3%
POVERTY | MARRIED-COUPLE FAMILIES
99.7/ 100
METRIC RATING
52nd/ 347
METRIC RANK

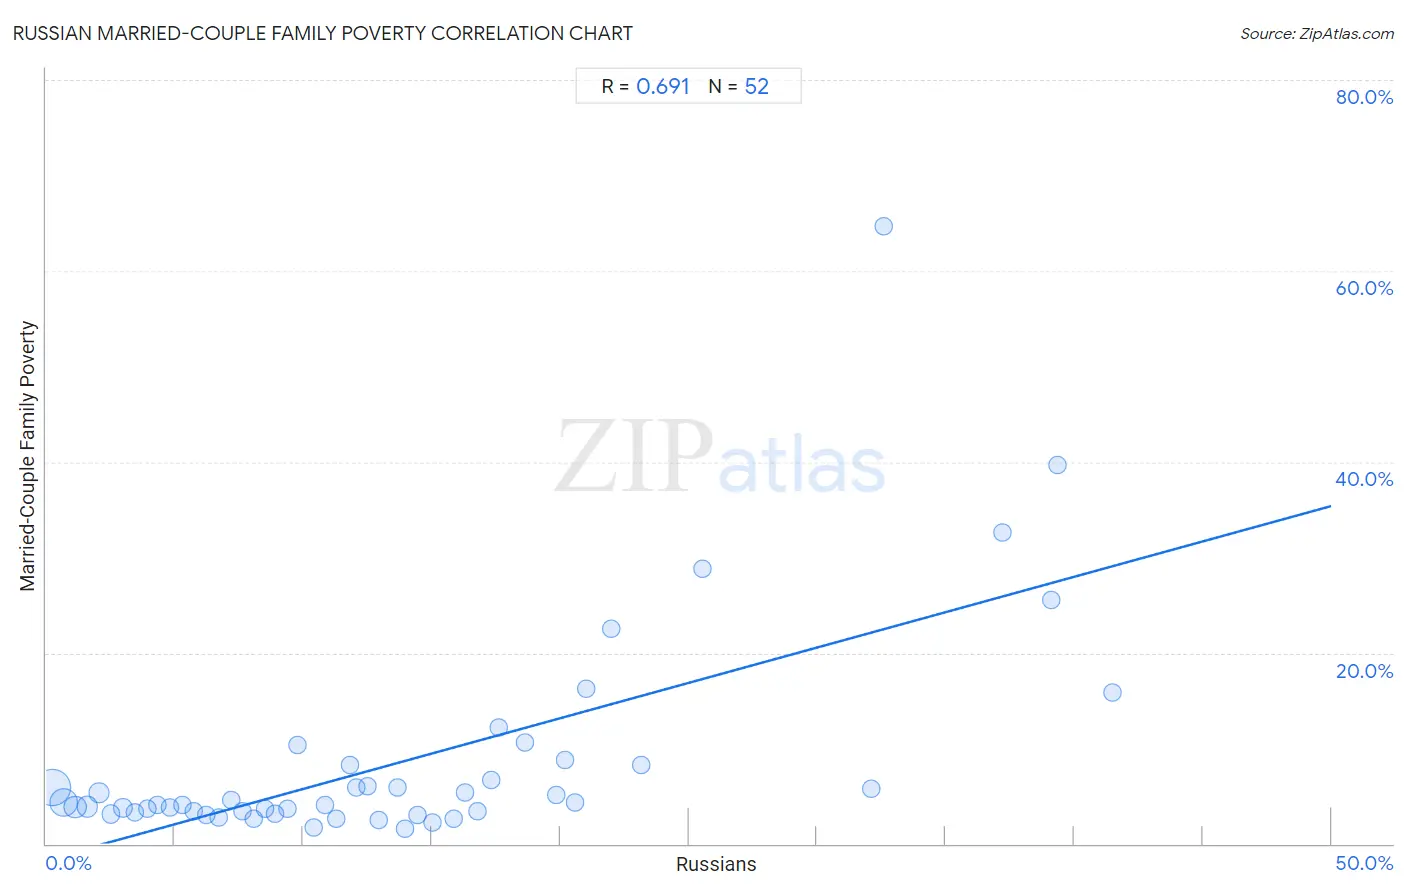
Russian Married-Couple Family Poverty Correlation Chart

The statistical analysis conducted on geographies consisting of 502,513,768 people shows a significant positive correlation between the proportion of Russians and poverty level among married-couple families in the United States with a correlation coefficient (R) of 0.691 and weighted average of 4.3%. On average, for every 1% (one percent) increase in Russians within a typical geography, there is an increase of 0.74% in poverty level among married-couple families.
Russian Married-Couple Family Poverty
It is essential to understand that the correlation between the percentage of Russians and poverty level among married-couple families does not imply a direct cause-and-effect relationship. It remains uncertain whether the presence of Russians influences an upward or downward trend in the level of poverty level among married-couple families within an area, or if Russians simply ended up residing in those areas with higher or lower levels of poverty level among married-couple families due to other factors.

Demographics Similar to Russians by Married-Couple Family Poverty

In terms of married-couple family poverty, the demographic groups most similar to Russians are Immigrants from Lithuania (4.3%, a difference of 0.030%), Burmese (4.3%, a difference of 0.040%), Turkish (4.3%, a difference of 0.13%), Welsh (4.3%, a difference of 0.15%), and Australian (4.3%, a difference of 0.21%).
DemographicsRating | RankMarried-Couple Family Poverty
Serbians
99.8
/100
|
#45
Exceptional
4.3%
British
99.8
/100
|
#46
Exceptional
4.3%
Immigrants from South Central Asia
99.8
/100
|
#47
Exceptional
4.3%
Australians
99.7
/100
|
#48
Exceptional
4.3%
Turks
99.7
/100
|
#49
Exceptional
4.3%
Burmese
99.7
/100
|
#50
Exceptional
4.3%
Immigrants from Lithuania
99.7
/100
|
#51
Exceptional
4.3%
Russians
99.7
/100
|
#52
Exceptional
4.3%
Welsh
99.7
/100
|
#53
Exceptional
4.3%
Austrians
99.7
/100
|
#54
Exceptional
4.3%
French
99.7
/100
|
#55
Exceptional
4.3%
Immigrants from Zimbabwe
99.7
/100
|
#56
Exceptional
4.3%
Immigrants from Netherlands
99.7
/100
|
#57
Exceptional
4.3%
Czechoslovakians
99.7
/100
|
#58
Exceptional
4.4%
Immigrants from Sweden
99.6
/100
|
#59
Exceptional
4.4%

Russian Married-Couple Family Poverty Correlation Summary

MeasurementRussian DataMarried-Couple Family Poverty Data
Minimum0.22%1.6%
Maximum41.5%64.7%
Range41.3%63.1%
Mean14.0%8.7%
Median11.9%4.1%
Interquartile 25% (IQ1)6.0%3.3%
Interquartile 75% (IQ3)19.2%8.3%
Interquartile Range (IQR)13.2%5.0%
Standard Deviation (Sample)10.6%11.4%
Standard Deviation (Population)10.5%11.3%

Correlation Details

Russian PercentileSample SizeMarried-Couple Family Poverty
[
0.0%
-
0.5%
]
0.22%
232,710,4995.8%
[
0.5%
-
1.0%
]
0.67%
124,911,9874.3%
[
1.0%
-
1.5%
]
1.12%
57,779,3473.8%
[
1.5%
-
2.0%
]
1.60%
35,142,9233.9%
[
2.0%
-
2.5%
]
2.07%
24,465,3225.3%
[
2.5%
-
3.0%
]
2.51%
7,965,5713.1%
[
2.5%
-
3.0%
]
2.98%
5,446,3673.7%
[
3.0%
-
3.5%
]
3.44%
3,194,4673.2%
[
3.5%
-
4.0%
]
3.92%
2,332,8763.7%
[
4.0%
-
4.5%
]
4.34%
2,195,9004.0%
[
4.5%
-
5.0%
]
4.82%
1,174,3813.7%
[
5.0%
-
5.5%
]
5.30%
1,258,4634.0%
[
5.5%
-
6.0%
]
5.73%
656,0003.4%
[
6.0%
-
6.5%
]
6.23%
739,9313.0%
[
6.5%
-
7.0%
]
6.71%
617,3922.8%
[
7.0%
-
7.5%
]
7.18%
363,2154.6%
[
7.5%
-
8.0%
]
7.63%
448,3273.4%
[
8.0%
-
8.5%
]
8.07%
280,3822.6%
[
8.0%
-
8.5%
]
8.49%
113,8833.7%
[
8.5%
-
9.0%
]
8.91%
219,9153.2%
[
9.0%
-
9.5%
]
9.39%
142,9833.6%
[
9.5%
-
10.0%
]
9.79%
83,19210.3%
[
10.0%
-
10.5%
]
10.39%
47,3061.6%
[
10.5%
-
11.0%
]
10.87%
26,7474.0%
[
11.0%
-
11.5%
]
11.27%
19,0912.6%
[
11.5%
-
12.0%
]
11.84%
1,1668.3%
[
12.0%
-
12.5%
]
12.05%
29,4195.9%
[
12.5%
-
13.0%
]
12.52%
7516.0%
[
12.5%
-
13.0%
]
12.93%
13,9142.5%
[
13.5%
-
14.0%
]
13.66%
3,6905.9%
[
13.5%
-
14.0%
]
13.95%
11,0681.6%
[
14.0%
-
14.5%
]
14.42%
11,9533.0%
[
15.0%
-
15.5%
]
15.03%
4,3522.2%
[
15.5%
-
16.0%
]
15.84%
3,0432.6%
[
16.0%
-
16.5%
]
16.32%
1,9125.4%
[
16.5%
-
17.0%
]
16.79%
3,7953.3%
[
17.0%
-
17.5%
]
17.32%
1,0396.6%
[
17.5%
-
18.0%
]
17.60%
83,06912.1%
[
18.5%
-
19.0%
]
18.61%
2,28910.7%
[
19.5%
-
20.0%
]
19.83%
2375.1%
[
20.0%
-
20.5%
]
20.21%
2,1088.8%
[
20.5%
-
21.0%
]
20.55%
2534.3%
[
21.0%
-
21.5%
]
21.01%
13816.2%
[
21.5%
-
22.0%
]
22.00%
44122.5%
[
23.0%
-
23.5%
]
23.15%
6918.3%
[
25.5%
-
26.0%
]
25.55%
36428.8%
[
32.0%
-
32.5%
]
32.12%
1375.7%
[
32.5%
-
33.0%
]
32.61%
9264.7%
[
37.0%
-
37.5%
]
37.21%
12932.6%
[
39.0%
-
39.5%
]
39.12%
97925.6%
[
39.0%
-
39.5%
]
39.33%
17839.6%
[
41.0%
-
41.5%
]
41.49%
9415.8%