Russian Disability
COMPARE
Russian
Select to Compare
Disability
Russian Disability
11.5%
DISABILITY
86.8/ 100
METRIC RATING
140th/ 347
METRIC RANK
Russian Disability Correlation Chart
The statistical analysis conducted on geographies consisting of 512,171,933 people shows a substantial positive correlation between the proportion of Russians and percentage of population with a disability in the United States with a correlation coefficient (R) of 0.569 and weighted average of 11.5%. On average, for every 1% (one percent) increase in Russians within a typical geography, there is an increase of 0.46% in percentage of population with a disability.
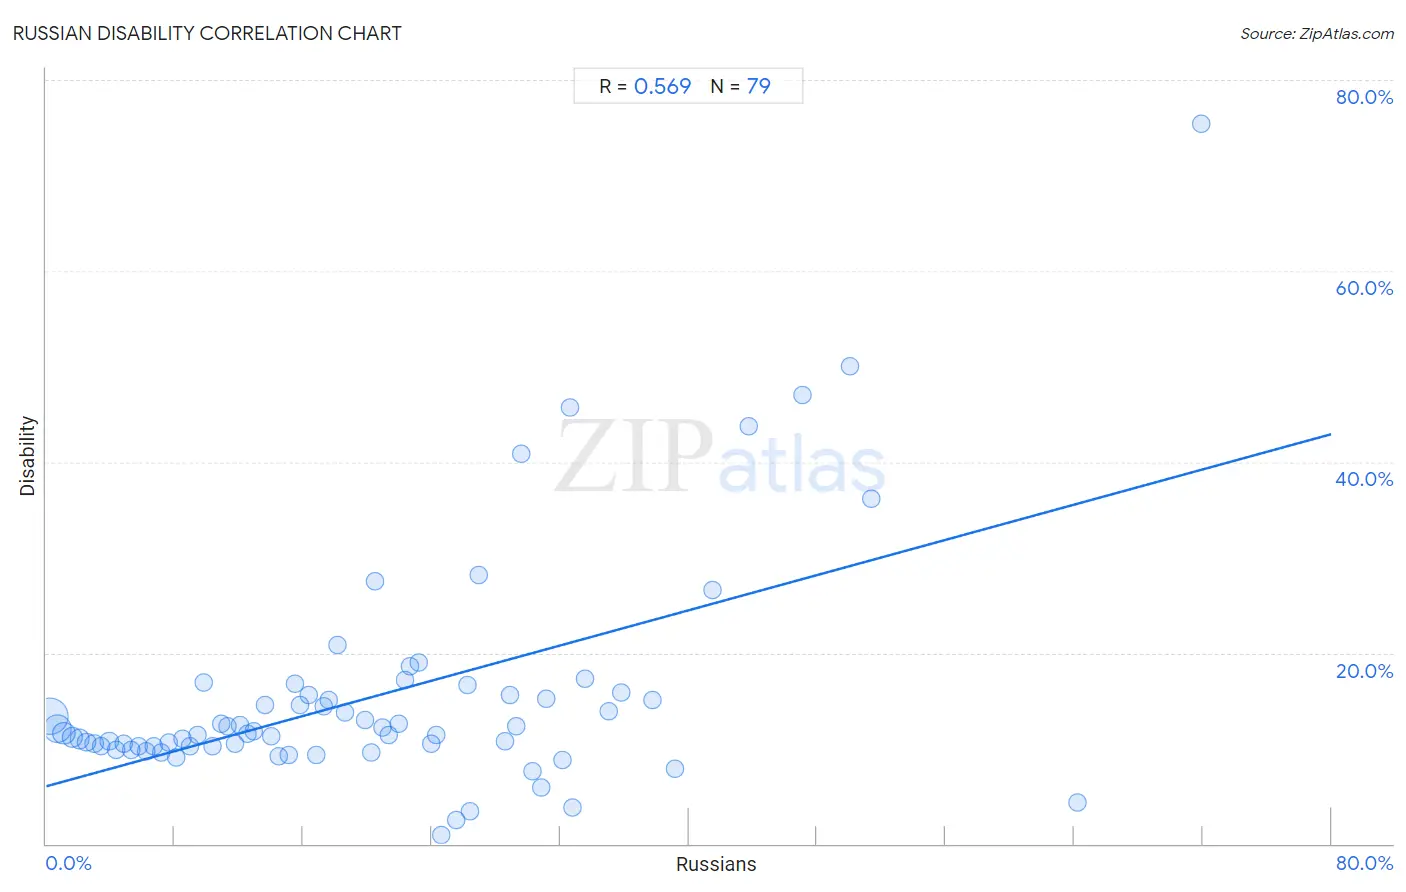
It is essential to understand that the correlation between the percentage of Russians and percentage of population with a disability does not imply a direct cause-and-effect relationship. It remains uncertain whether the presence of Russians influences an upward or downward trend in the level of percentage of population with a disability within an area, or if Russians simply ended up residing in those areas with higher or lower levels of percentage of population with a disability due to other factors.
Demographics Similar to Russians by Disability
In terms of disability, the demographic groups most similar to Russians are New Zealander (11.5%, a difference of 0.020%), Ghanaian (11.5%, a difference of 0.020%), Kenyan (11.5%, a difference of 0.030%), Immigrants from Grenada (11.5%, a difference of 0.070%), and Immigrants from St. Vincent and the Grenadines (11.4%, a difference of 0.10%).
| Demographics | Rating | Rank | Disability |
| Arabs | 89.1 /100 | #133 | Excellent 11.4% |
| Immigrants from Guyana | 88.3 /100 | #134 | Excellent 11.4% |
| Ugandans | 87.9 /100 | #135 | Excellent 11.4% |
| Immigrants from St. Vincent and the Grenadines | 87.8 /100 | #136 | Excellent 11.4% |
| Kenyans | 87.1 /100 | #137 | Excellent 11.5% |
| New Zealanders | 87.0 /100 | #138 | Excellent 11.5% |
| Ghanaians | 87.0 /100 | #139 | Excellent 11.5% |
| Russians | 86.8 /100 | #140 | Excellent 11.5% |
| Immigrants from Grenada | 86.1 /100 | #141 | Excellent 11.5% |
| Immigrants from Sudan | 85.3 /100 | #142 | Excellent 11.5% |
| Moroccans | 83.3 /100 | #143 | Excellent 11.5% |
| Australians | 82.5 /100 | #144 | Excellent 11.5% |
| Nigerians | 81.3 /100 | #145 | Excellent 11.5% |
| Immigrants from Hungary | 79.0 /100 | #146 | Good 11.5% |
| Immigrants from Ukraine | 77.6 /100 | #147 | Good 11.5% |
Russian Disability Correlation Summary
| Measurement | Russian Data | Disability Data |
| Minimum | 0.22% | 0.92% |
| Maximum | 71.9% | 75.4% |
| Range | 71.7% | 74.5% |
| Mean | 20.4% | 15.4% |
| Median | 18.1% | 11.6% |
| Interquartile 25% (IQ1) | 8.9% | 10.2% |
| Interquartile 75% (IQ3) | 29.2% | 15.6% |
| Interquartile Range (IQR) | 20.3% | 5.4% |
| Standard Deviation (Sample) | 14.7% | 11.9% |
| Standard Deviation (Population) | 14.6% | 11.8% |
Correlation Details
| Russian Percentile | Sample Size | Disability |
[ 0.0% - 0.5% ] 0.22% | 235,437,253 | 13.3% |
[ 0.5% - 1.0% ] 0.67% | 127,163,226 | 12.1% |
[ 1.0% - 1.5% ] 1.12% | 59,156,711 | 11.6% |
[ 1.5% - 2.0% ] 1.60% | 36,200,990 | 11.1% |
[ 2.0% - 2.5% ] 2.07% | 25,046,550 | 11.0% |
[ 2.5% - 3.0% ] 2.51% | 8,434,329 | 10.7% |
[ 2.5% - 3.0% ] 2.98% | 5,722,904 | 10.5% |
[ 3.0% - 3.5% ] 3.44% | 3,360,708 | 10.2% |
[ 3.5% - 4.0% ] 3.92% | 2,495,295 | 10.7% |
[ 4.0% - 4.5% ] 4.34% | 2,291,805 | 9.8% |
[ 4.5% - 5.0% ] 4.82% | 1,275,188 | 10.5% |
[ 5.0% - 5.5% ] 5.30% | 1,321,933 | 9.8% |
[ 5.5% - 6.0% ] 5.73% | 753,252 | 10.3% |
[ 6.0% - 6.5% ] 6.23% | 785,806 | 9.7% |
[ 6.5% - 7.0% ] 6.71% | 629,844 | 10.2% |
[ 7.0% - 7.5% ] 7.18% | 392,839 | 9.6% |
[ 7.5% - 8.0% ] 7.63% | 465,138 | 10.5% |
[ 8.0% - 8.5% ] 8.08% | 297,129 | 9.0% |
[ 8.0% - 8.5% ] 8.49% | 120,502 | 11.0% |
[ 8.5% - 9.0% ] 8.91% | 226,336 | 10.2% |
[ 9.0% - 9.5% ] 9.39% | 151,653 | 11.3% |
[ 9.5% - 10.0% ] 9.80% | 88,719 | 16.9% |
[ 10.0% - 10.5% ] 10.39% | 62,497 | 10.2% |
[ 10.5% - 11.0% ] 10.88% | 28,302 | 12.6% |
[ 11.0% - 11.5% ] 11.29% | 28,675 | 12.3% |
[ 11.5% - 12.0% ] 11.76% | 14,718 | 10.5% |
[ 12.0% - 12.5% ] 12.07% | 32,989 | 12.5% |
[ 12.5% - 13.0% ] 12.54% | 4,475 | 11.5% |
[ 12.5% - 13.0% ] 12.93% | 14,112 | 11.8% |
[ 13.5% - 14.0% ] 13.65% | 4,616 | 14.6% |
[ 14.0% - 14.5% ] 14.01% | 17,047 | 11.3% |
[ 14.0% - 14.5% ] 14.45% | 13,935 | 9.1% |
[ 15.0% - 15.5% ] 15.08% | 7,559 | 9.3% |
[ 15.0% - 15.5% ] 15.49% | 1,504 | 16.8% |
[ 15.5% - 16.0% ] 15.82% | 5,555 | 14.6% |
[ 16.0% - 16.5% ] 16.31% | 3,096 | 15.6% |
[ 16.5% - 17.0% ] 16.83% | 4,873 | 9.3% |
[ 17.0% - 17.5% ] 17.31% | 2,606 | 14.5% |
[ 17.5% - 18.0% ] 17.60% | 83,069 | 15.0% |
[ 18.0% - 18.5% ] 18.11% | 370 | 20.8% |
[ 18.5% - 19.0% ] 18.61% | 2,364 | 13.7% |
[ 19.5% - 20.0% ] 19.83% | 237 | 13.0% |
[ 20.0% - 20.5% ] 20.23% | 2,640 | 9.6% |
[ 20.0% - 20.5% ] 20.46% | 3,186 | 27.5% |
[ 20.5% - 21.0% ] 20.92% | 980 | 12.1% |
[ 21.0% - 21.5% ] 21.36% | 618 | 11.4% |
[ 21.5% - 22.0% ] 21.96% | 510 | 12.5% |
[ 22.0% - 22.5% ] 22.33% | 2,580 | 17.2% |
[ 22.5% - 23.0% ] 22.68% | 291 | 18.6% |
[ 23.0% - 23.5% ] 23.19% | 789 | 19.0% |
[ 23.5% - 24.0% ] 23.95% | 526 | 10.5% |
[ 24.0% - 24.5% ] 24.29% | 140 | 11.4% |
[ 24.5% - 25.0% ] 24.57% | 867 | 0.92% |
[ 25.5% - 26.0% ] 25.55% | 364 | 2.5% |
[ 26.0% - 26.5% ] 26.24% | 724 | 16.6% |
[ 26.0% - 26.5% ] 26.35% | 353 | 3.4% |
[ 26.5% - 27.0% ] 26.92% | 78 | 28.2% |
[ 28.5% - 29.0% ] 28.57% | 56 | 10.7% |
[ 28.5% - 29.0% ] 28.89% | 90 | 15.6% |
[ 29.0% - 29.5% ] 29.23% | 1,683 | 12.4% |
[ 29.5% - 30.0% ] 29.55% | 44 | 40.9% |
[ 30.0% - 30.5% ] 30.30% | 462 | 7.6% |
[ 30.5% - 31.0% ] 30.83% | 120 | 5.8% |
[ 31.0% - 31.5% ] 31.13% | 681 | 15.1% |
[ 32.0% - 32.5% ] 32.12% | 137 | 8.8% |
[ 32.5% - 33.0% ] 32.61% | 92 | 45.7% |
[ 32.5% - 33.0% ] 32.79% | 427 | 3.8% |
[ 33.5% - 34.0% ] 33.54% | 319 | 17.2% |
[ 34.5% - 35.0% ] 35.00% | 640 | 13.9% |
[ 35.5% - 36.0% ] 35.79% | 95 | 15.8% |
[ 37.5% - 38.0% ] 37.74% | 106 | 15.1% |
[ 39.0% - 39.5% ] 39.12% | 979 | 7.9% |
[ 41.0% - 41.5% ] 41.49% | 94 | 26.6% |
[ 43.5% - 44.0% ] 43.75% | 16 | 43.8% |
[ 47.0% - 47.5% ] 47.06% | 51 | 47.1% |
[ 50.0% - 50.5% ] 50.00% | 12 | 50.0% |
[ 51.0% - 51.5% ] 51.39% | 72 | 36.1% |
[ 64.0% - 64.5% ] 64.23% | 274 | 4.4% |
[ 71.5% - 72.0% ] 71.88% | 128 | 75.4% |