Russian College, Under 1 year
COMPARE
Russian
Select to Compare
College, Under 1 year
Russian College, Under 1 year
70.5%
COLLEGE, UNDER 1 YEAR
99.9/ 100
METRIC RATING
35th/ 347
METRIC RANK
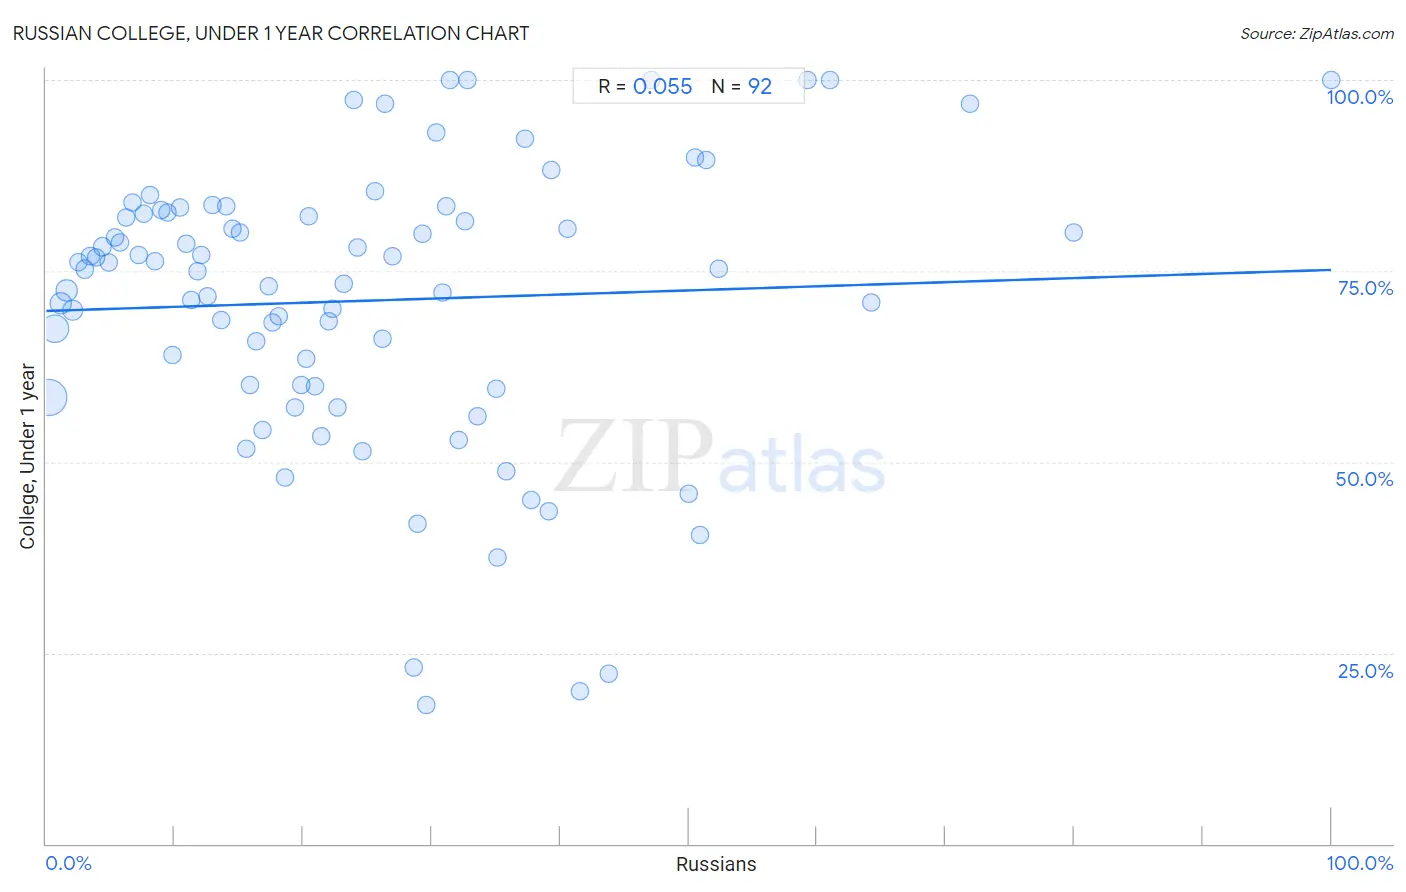
Russian College, Under 1 year Correlation Chart
The statistical analysis conducted on geographies consisting of 512,255,371 people shows a slight positive correlation between the proportion of Russians and percentage of population with at least college, under 1 year education in the United States with a correlation coefficient (R) of 0.055 and weighted average of 70.5%. On average, for every 1% (one percent) increase in Russians within a typical geography, there is an increase of 0.054% in percentage of population with at least college, under 1 year education.
It is essential to understand that the correlation between the percentage of Russians and percentage of population with at least college, under 1 year education does not imply a direct cause-and-effect relationship. It remains uncertain whether the presence of Russians influences an upward or downward trend in the level of percentage of population with at least college, under 1 year education within an area, or if Russians simply ended up residing in those areas with higher or lower levels of percentage of population with at least college, under 1 year education due to other factors.
Demographics Similar to Russians by College, Under 1 year
In terms of college, under 1 year, the demographic groups most similar to Russians are Immigrants from Sri Lanka (70.5%, a difference of 0.060%), Estonian (70.6%, a difference of 0.080%), Immigrants from South Africa (70.6%, a difference of 0.10%), Immigrants from Saudi Arabia (70.4%, a difference of 0.17%), and Australian (70.4%, a difference of 0.25%).
| Demographics | Rating | Rank | College, Under 1 year |
| Immigrants from Hong Kong | 100.0 /100 | #28 | Exceptional 71.0% |
| Immigrants from France | 100.0 /100 | #29 | Exceptional 71.0% |
| Immigrants from China | 99.9 /100 | #30 | Exceptional 70.9% |
| Indians (Asian) | 99.9 /100 | #31 | Exceptional 70.8% |
| Turks | 99.9 /100 | #32 | Exceptional 70.7% |
| Immigrants from South Africa | 99.9 /100 | #33 | Exceptional 70.6% |
| Estonians | 99.9 /100 | #34 | Exceptional 70.6% |
| Russians | 99.9 /100 | #35 | Exceptional 70.5% |
| Immigrants from Sri Lanka | 99.9 /100 | #36 | Exceptional 70.5% |
| Immigrants from Saudi Arabia | 99.9 /100 | #37 | Exceptional 70.4% |
| Australians | 99.9 /100 | #38 | Exceptional 70.4% |
| Bhutanese | 99.9 /100 | #39 | Exceptional 70.3% |
| Immigrants from Turkey | 99.9 /100 | #40 | Exceptional 70.3% |
| Immigrants from Kuwait | 99.9 /100 | #41 | Exceptional 70.3% |
| Immigrants from Lithuania | 99.9 /100 | #42 | Exceptional 70.3% |
Russian College, Under 1 year Correlation Summary
| Measurement | Russian Data | College, Under 1 year Data |
| Minimum | 0.22% | 18.2% |
| Maximum | 100.0% | 100.0% |
| Range | 99.8% | 81.8% |
| Mean | 24.7% | 71.1% |
| Median | 21.1% | 75.2% |
| Interquartile 25% (IQ1) | 10.6% | 60.0% |
| Interquartile 75% (IQ3) | 33.2% | 82.5% |
| Interquartile Range (IQR) | 22.5% | 22.5% |
| Standard Deviation (Sample) | 18.9% | 18.5% |
| Standard Deviation (Population) | 18.8% | 18.4% |
Correlation Details
| Russian Percentile | Sample Size | College, Under 1 year |
[ 0.0% - 0.5% ] 0.22% | 235,482,160 | 58.3% |
[ 0.5% - 1.0% ] 0.67% | 127,177,366 | 67.4% |
[ 1.0% - 1.5% ] 1.12% | 59,174,809 | 70.8% |
[ 1.5% - 2.0% ] 1.60% | 36,196,633 | 72.4% |
[ 2.0% - 2.5% ] 2.07% | 25,044,714 | 69.8% |
[ 2.5% - 3.0% ] 2.51% | 8,435,757 | 76.1% |
[ 2.5% - 3.0% ] 2.98% | 5,723,107 | 75.3% |
[ 3.0% - 3.5% ] 3.44% | 3,361,267 | 76.9% |
[ 3.5% - 4.0% ] 3.92% | 2,497,059 | 76.8% |
[ 4.0% - 4.5% ] 4.34% | 2,292,444 | 78.2% |
[ 4.5% - 5.0% ] 4.82% | 1,276,372 | 76.0% |
[ 5.0% - 5.5% ] 5.30% | 1,322,303 | 79.4% |
[ 5.5% - 6.0% ] 5.73% | 753,727 | 78.7% |
[ 6.0% - 6.5% ] 6.23% | 785,806 | 82.0% |
[ 6.5% - 7.0% ] 6.71% | 630,176 | 84.0% |
[ 7.0% - 7.5% ] 7.18% | 392,839 | 77.1% |
[ 7.5% - 8.0% ] 7.63% | 465,483 | 82.5% |
[ 8.0% - 8.5% ] 8.08% | 297,545 | 84.9% |
[ 8.0% - 8.5% ] 8.49% | 120,824 | 76.3% |
[ 8.5% - 9.0% ] 8.92% | 226,952 | 83.0% |
[ 9.0% - 9.5% ] 9.39% | 151,653 | 82.6% |
[ 9.5% - 10.0% ] 9.80% | 88,719 | 63.9% |
[ 10.0% - 10.5% ] 10.39% | 62,565 | 83.3% |
[ 10.5% - 11.0% ] 10.88% | 28,302 | 78.5% |
[ 11.0% - 11.5% ] 11.29% | 28,675 | 71.1% |
[ 11.5% - 12.0% ] 11.76% | 14,718 | 74.9% |
[ 12.0% - 12.5% ] 12.07% | 32,989 | 77.1% |
[ 12.5% - 13.0% ] 12.54% | 4,475 | 71.6% |
[ 12.5% - 13.0% ] 12.93% | 14,112 | 83.7% |
[ 13.5% - 14.0% ] 13.65% | 4,616 | 68.6% |
[ 14.0% - 14.5% ] 14.01% | 17,649 | 83.4% |
[ 14.0% - 14.5% ] 14.45% | 13,935 | 80.6% |
[ 15.0% - 15.5% ] 15.08% | 7,559 | 80.1% |
[ 15.5% - 16.0% ] 15.54% | 2,065 | 51.8% |
[ 15.5% - 16.0% ] 15.82% | 5,555 | 60.1% |
[ 16.0% - 16.5% ] 16.31% | 3,096 | 65.8% |
[ 16.5% - 17.0% ] 16.83% | 4,903 | 54.1% |
[ 17.0% - 17.5% ] 17.31% | 2,606 | 73.0% |
[ 17.5% - 18.0% ] 17.59% | 83,126 | 68.2% |
[ 18.0% - 18.5% ] 18.10% | 569 | 69.1% |
[ 18.5% - 19.0% ] 18.61% | 2,364 | 47.9% |
[ 19.0% - 19.5% ] 19.35% | 31 | 57.1% |
[ 19.5% - 20.0% ] 19.83% | 237 | 60.1% |
[ 20.0% - 20.5% ] 20.23% | 2,640 | 63.5% |
[ 20.0% - 20.5% ] 20.46% | 3,186 | 82.2% |
[ 20.5% - 21.0% ] 20.92% | 980 | 59.9% |
[ 21.0% - 21.5% ] 21.36% | 618 | 53.3% |
[ 21.5% - 22.0% ] 21.96% | 510 | 68.3% |
[ 22.0% - 22.5% ] 22.32% | 2,943 | 70.1% |
[ 22.5% - 23.0% ] 22.68% | 291 | 57.1% |
[ 23.0% - 23.5% ] 23.19% | 789 | 73.3% |
[ 23.5% - 24.0% ] 23.93% | 610 | 97.3% |
[ 24.0% - 24.5% ] 24.21% | 318 | 78.1% |
[ 24.5% - 25.0% ] 24.57% | 867 | 51.4% |
[ 25.5% - 26.0% ] 25.55% | 364 | 85.5% |
[ 26.0% - 26.5% ] 26.21% | 847 | 66.1% |
[ 26.0% - 26.5% ] 26.36% | 368 | 96.9% |
[ 26.5% - 27.0% ] 26.92% | 78 | 76.9% |
[ 28.5% - 29.0% ] 28.57% | 56 | 23.1% |
[ 28.5% - 29.0% ] 28.89% | 90 | 41.9% |
[ 29.0% - 29.5% ] 29.23% | 1,683 | 79.9% |
[ 29.5% - 30.0% ] 29.55% | 44 | 18.2% |
[ 30.0% - 30.5% ] 30.30% | 462 | 93.1% |
[ 30.5% - 31.0% ] 30.83% | 120 | 72.2% |
[ 31.0% - 31.5% ] 31.13% | 681 | 83.4% |
[ 31.0% - 31.5% ] 31.43% | 70 | 100.0% |
[ 32.0% - 32.5% ] 32.13% | 305 | 52.8% |
[ 32.5% - 33.0% ] 32.61% | 92 | 81.5% |
[ 32.5% - 33.0% ] 32.80% | 503 | 100.0% |
[ 33.5% - 34.0% ] 33.54% | 319 | 56.0% |
[ 34.5% - 35.0% ] 35.00% | 640 | 59.5% |
[ 35.0% - 35.5% ] 35.14% | 74 | 37.5% |
[ 35.5% - 36.0% ] 35.79% | 95 | 48.7% |
[ 37.0% - 37.5% ] 37.21% | 129 | 92.3% |
[ 37.5% - 38.0% ] 37.74% | 106 | 44.9% |
[ 39.0% - 39.5% ] 39.12% | 979 | 43.5% |
[ 39.0% - 39.5% ] 39.32% | 234 | 88.3% |
[ 40.5% - 41.0% ] 40.56% | 143 | 80.5% |
[ 41.0% - 41.5% ] 41.49% | 94 | 20.0% |
[ 43.5% - 44.0% ] 43.75% | 16 | 22.2% |
[ 47.0% - 47.5% ] 47.06% | 51 | 100.0% |
[ 50.0% - 50.5% ] 50.00% | 24 | 45.8% |
[ 50.0% - 50.5% ] 50.50% | 202 | 89.9% |
[ 50.5% - 51.0% ] 50.90% | 167 | 40.5% |
[ 51.0% - 51.5% ] 51.39% | 72 | 89.5% |
[ 52.0% - 52.5% ] 52.38% | 105 | 75.2% |
[ 59.0% - 59.5% ] 59.26% | 27 | 100.0% |
[ 61.0% - 61.5% ] 61.04% | 77 | 100.0% |
[ 64.0% - 64.5% ] 64.23% | 274 | 70.8% |
[ 71.5% - 72.0% ] 71.88% | 128 | 96.9% |
[ 80.0% - 80.5% ] 80.00% | 10 | 80.0% |
[ 99.5% - 100.0% ] 100.00% | 28 | 100.0% |