Russian 4 or more Vehicles in Household
COMPARE
Russian
Select to Compare
4 or more Vehicles in Household
Russian 4 or more Vehicles in Household
6.0%
4+ VEHICLES AVAILABLE
10.3/ 100
METRIC RATING
220th/ 347
METRIC RANK
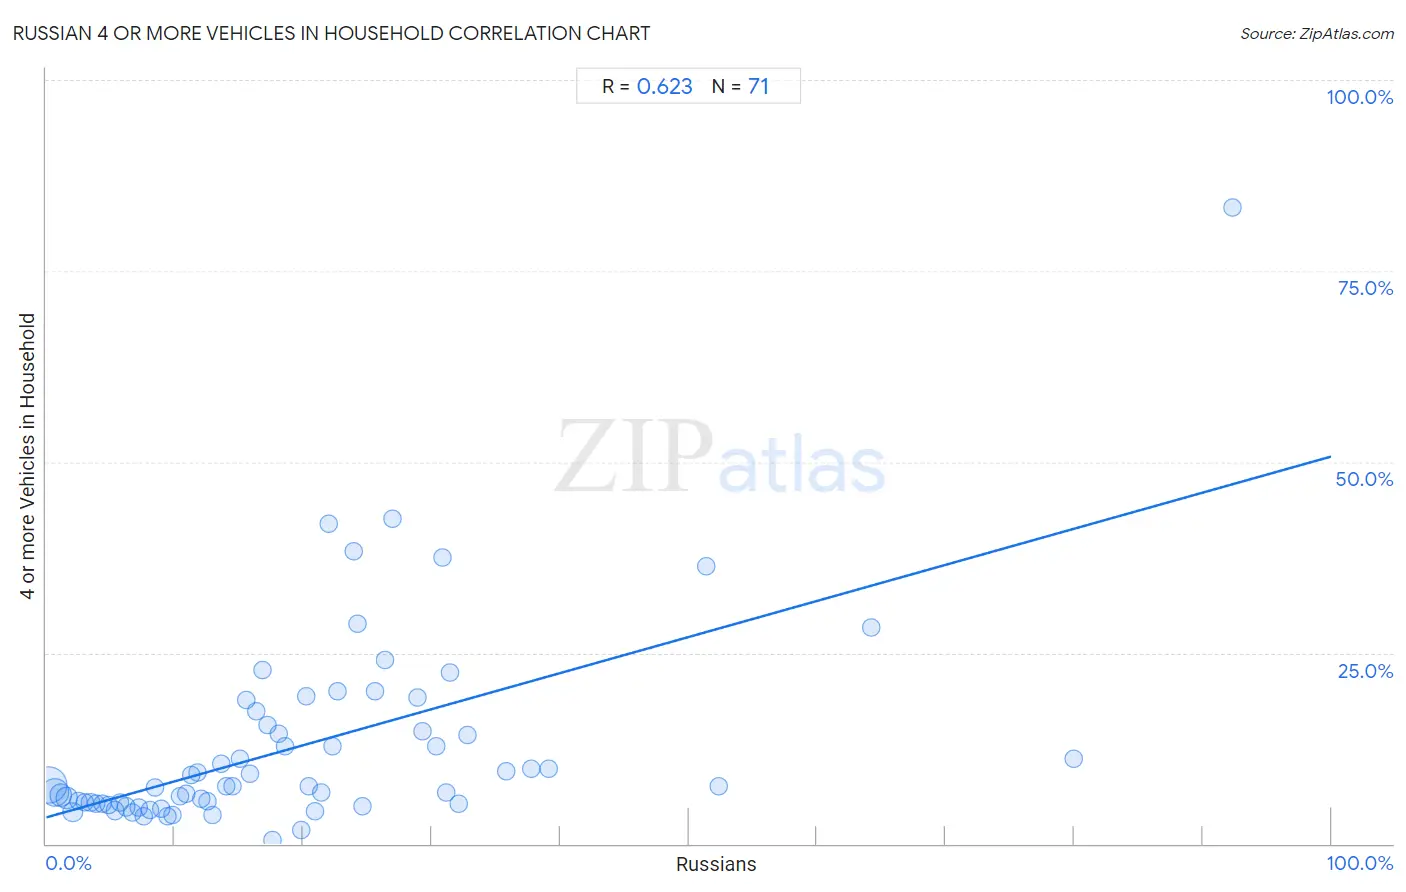
Russian 4 or more Vehicles in Household Correlation Chart
The statistical analysis conducted on geographies consisting of 509,368,397 people shows a significant positive correlation between the proportion of Russians and percentage of households with 4 or more vehicles available in the United States with a correlation coefficient (R) of 0.623 and weighted average of 6.0%. On average, for every 1% (one percent) increase in Russians within a typical geography, there is an increase of 0.47% in percentage of households with 4 or more vehicles available.
It is essential to understand that the correlation between the percentage of Russians and percentage of households with 4 or more vehicles available does not imply a direct cause-and-effect relationship. It remains uncertain whether the presence of Russians influences an upward or downward trend in the level of percentage of households with 4 or more vehicles available within an area, or if Russians simply ended up residing in those areas with higher or lower levels of percentage of households with 4 or more vehicles available due to other factors.
Demographics Similar to Russians by 4 or more Vehicles in Household
In terms of 4 or more vehicles in household, the demographic groups most similar to Russians are Immigrants from Italy (6.0%, a difference of 0.19%), Serbian (6.0%, a difference of 0.19%), Immigrants from Moldova (6.0%, a difference of 0.29%), Cajun (6.0%, a difference of 0.33%), and Immigrants from Kenya (6.0%, a difference of 0.33%).
| Demographics | Rating | Rank | 4 or more Vehicles in Household |
| Arabs | 14.4 /100 | #213 | Poor 6.0% |
| Immigrants from Austria | 14.3 /100 | #214 | Poor 6.0% |
| Immigrants from China | 13.8 /100 | #215 | Poor 6.0% |
| Immigrants from Romania | 13.8 /100 | #216 | Poor 6.0% |
| Nigerians | 12.2 /100 | #217 | Poor 6.0% |
| Immigrants from Italy | 11.0 /100 | #218 | Poor 6.0% |
| Serbians | 11.0 /100 | #219 | Poor 6.0% |
| Russians | 10.3 /100 | #220 | Poor 6.0% |
| Immigrants from Moldova | 9.3 /100 | #221 | Tragic 6.0% |
| Cajuns | 9.2 /100 | #222 | Tragic 6.0% |
| Immigrants from Kenya | 9.2 /100 | #223 | Tragic 6.0% |
| Cubans | 9.2 /100 | #224 | Tragic 6.0% |
| Indonesians | 8.9 /100 | #225 | Tragic 6.0% |
| Immigrants from Singapore | 7.9 /100 | #226 | Tragic 5.9% |
| Immigrants from Western Asia | 7.8 /100 | #227 | Tragic 5.9% |
Russian 4 or more Vehicles in Household Correlation Summary
| Measurement | Russian Data | 4 or more Vehicles in Household Data |
| Minimum | 0.22% | 0.51% |
| Maximum | 92.3% | 83.3% |
| Range | 92.1% | 82.8% |
| Mean | 19.8% | 12.8% |
| Median | 16.3% | 7.5% |
| Interquartile 25% (IQ1) | 8.1% | 5.3% |
| Interquartile 75% (IQ3) | 26.3% | 15.6% |
| Interquartile Range (IQR) | 18.2% | 10.3% |
| Standard Deviation (Sample) | 17.2% | 13.0% |
| Standard Deviation (Population) | 17.1% | 12.9% |
Correlation Details
| Russian Percentile | Sample Size | 4 or more Vehicles in Household |
[ 0.0% - 0.5% ] 0.22% | 234,829,347 | 7.7% |
[ 0.5% - 1.0% ] 0.67% | 126,548,959 | 6.8% |
[ 1.0% - 1.5% ] 1.12% | 58,831,296 | 6.3% |
[ 1.5% - 2.0% ] 1.60% | 35,875,177 | 6.0% |
[ 2.0% - 2.5% ] 2.06% | 24,850,483 | 4.1% |
[ 2.5% - 3.0% ] 2.51% | 8,327,031 | 5.6% |
[ 2.5% - 3.0% ] 2.98% | 5,610,775 | 5.4% |
[ 3.0% - 3.5% ] 3.44% | 3,326,345 | 5.4% |
[ 3.5% - 4.0% ] 3.92% | 2,412,293 | 5.3% |
[ 4.0% - 4.5% ] 4.34% | 2,170,836 | 5.3% |
[ 4.5% - 5.0% ] 4.82% | 1,260,723 | 5.1% |
[ 5.0% - 5.5% ] 5.30% | 1,287,668 | 4.3% |
[ 5.5% - 6.0% ] 5.72% | 705,106 | 5.4% |
[ 6.0% - 6.5% ] 6.23% | 775,706 | 4.8% |
[ 6.5% - 7.0% ] 6.71% | 620,511 | 4.2% |
[ 7.0% - 7.5% ] 7.17% | 344,511 | 4.8% |
[ 7.5% - 8.0% ] 7.63% | 460,676 | 3.7% |
[ 8.0% - 8.5% ] 8.10% | 232,246 | 4.5% |
[ 8.0% - 8.5% ] 8.49% | 119,308 | 7.3% |
[ 8.5% - 9.0% ] 8.91% | 216,624 | 4.6% |
[ 9.0% - 9.5% ] 9.39% | 151,005 | 3.6% |
[ 9.5% - 10.0% ] 9.80% | 77,441 | 3.7% |
[ 10.0% - 10.5% ] 10.39% | 61,304 | 6.3% |
[ 10.5% - 11.0% ] 10.89% | 25,813 | 6.5% |
[ 11.0% - 11.5% ] 11.28% | 26,211 | 8.9% |
[ 11.5% - 12.0% ] 11.75% | 13,133 | 9.4% |
[ 12.0% - 12.5% ] 12.06% | 29,524 | 5.8% |
[ 12.5% - 13.0% ] 12.54% | 4,475 | 5.5% |
[ 12.5% - 13.0% ] 12.93% | 13,967 | 3.7% |
[ 13.5% - 14.0% ] 13.65% | 3,809 | 10.4% |
[ 14.0% - 14.5% ] 14.01% | 16,813 | 7.5% |
[ 14.0% - 14.5% ] 14.45% | 13,935 | 7.5% |
[ 15.0% - 15.5% ] 15.08% | 7,075 | 11.1% |
[ 15.5% - 16.0% ] 15.52% | 1,160 | 18.9% |
[ 15.5% - 16.0% ] 15.81% | 5,237 | 9.2% |
[ 16.0% - 16.5% ] 16.31% | 3,096 | 17.4% |
[ 16.5% - 17.0% ] 16.83% | 4,891 | 22.7% |
[ 17.0% - 17.5% ] 17.26% | 1,912 | 15.6% |
[ 17.5% - 18.0% ] 17.59% | 83,126 | 0.51% |
[ 18.0% - 18.5% ] 18.14% | 397 | 14.3% |
[ 18.5% - 19.0% ] 18.61% | 2,289 | 12.8% |
[ 19.5% - 20.0% ] 19.83% | 237 | 1.8% |
[ 20.0% - 20.5% ] 20.21% | 2,108 | 19.3% |
[ 20.0% - 20.5% ] 20.48% | 840 | 7.5% |
[ 20.5% - 21.0% ] 20.90% | 842 | 4.3% |
[ 21.0% - 21.5% ] 21.36% | 618 | 6.7% |
[ 21.5% - 22.0% ] 21.99% | 423 | 41.9% |
[ 22.0% - 22.5% ] 22.32% | 2,943 | 12.8% |
[ 22.5% - 23.0% ] 22.68% | 291 | 20.0% |
[ 23.5% - 24.0% ] 23.95% | 526 | 38.3% |
[ 24.0% - 24.5% ] 24.21% | 318 | 28.8% |
[ 24.5% - 25.0% ] 24.57% | 867 | 4.9% |
[ 25.5% - 26.0% ] 25.57% | 395 | 20.0% |
[ 26.0% - 26.5% ] 26.35% | 353 | 24.0% |
[ 26.5% - 27.0% ] 26.92% | 78 | 42.5% |
[ 28.5% - 29.0% ] 28.89% | 90 | 19.2% |
[ 29.0% - 29.5% ] 29.23% | 1,683 | 14.8% |
[ 30.0% - 30.5% ] 30.30% | 462 | 12.7% |
[ 30.5% - 31.0% ] 30.83% | 120 | 37.5% |
[ 31.0% - 31.5% ] 31.13% | 681 | 6.7% |
[ 31.0% - 31.5% ] 31.43% | 70 | 22.5% |
[ 32.0% - 32.5% ] 32.12% | 137 | 5.2% |
[ 32.5% - 33.0% ] 32.79% | 427 | 14.2% |
[ 35.5% - 36.0% ] 35.79% | 95 | 9.5% |
[ 37.5% - 38.0% ] 37.74% | 106 | 9.7% |
[ 39.0% - 39.5% ] 39.12% | 979 | 9.8% |
[ 51.0% - 51.5% ] 51.39% | 72 | 36.4% |
[ 52.0% - 52.5% ] 52.38% | 105 | 7.6% |
[ 64.0% - 64.5% ] 64.23% | 274 | 28.4% |
[ 80.0% - 80.5% ] 80.00% | 10 | 11.1% |
[ 92.0% - 92.5% ] 92.31% | 13 | 83.3% |