Russian Self-Care Disability
COMPARE
Russian
Select to Compare
Self-Care Disability
Russian Self-Care Disability
2.4%
SELF-CARE DISABILITY
88.2/ 100
METRIC RATING
134th/ 347
METRIC RANK
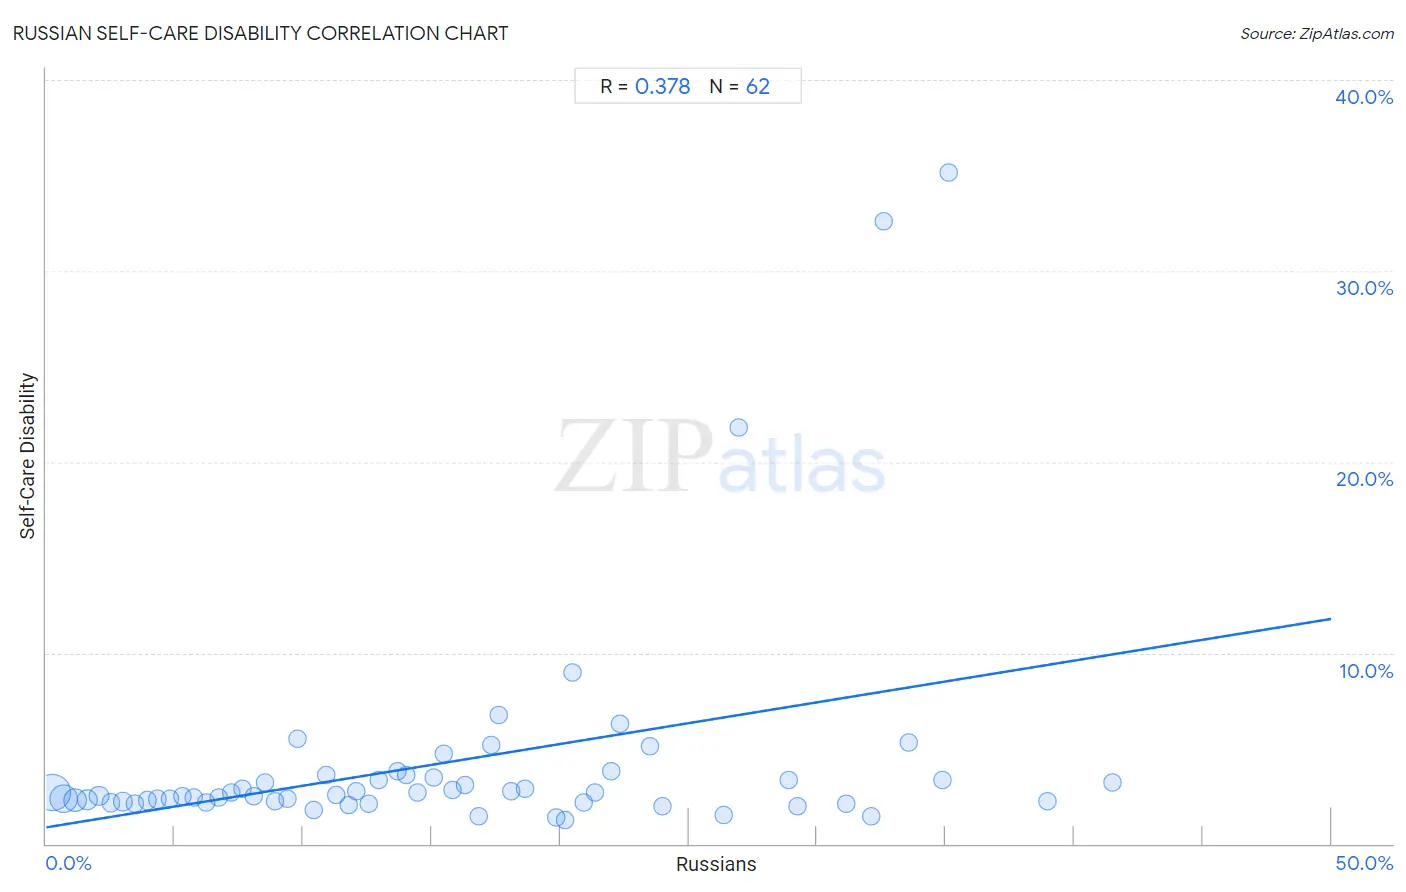
Russian Self-Care Disability Correlation Chart
The statistical analysis conducted on geographies consisting of 510,848,138 people shows a mild positive correlation between the proportion of Russians and percentage of population with self-care disability in the United States with a correlation coefficient (R) of 0.378 and weighted average of 2.4%. On average, for every 1% (one percent) increase in Russians within a typical geography, there is an increase of 0.22% in percentage of population with self-care disability.
It is essential to understand that the correlation between the percentage of Russians and percentage of population with self-care disability does not imply a direct cause-and-effect relationship. It remains uncertain whether the presence of Russians influences an upward or downward trend in the level of percentage of population with self-care disability within an area, or if Russians simply ended up residing in those areas with higher or lower levels of percentage of population with self-care disability due to other factors.
Demographics Similar to Russians by Self-Care Disability
In terms of self-care disability, the demographic groups most similar to Russians are Immigrants from Colombia (2.4%, a difference of 0.040%), Laotian (2.4%, a difference of 0.050%), Immigrants from South America (2.4%, a difference of 0.070%), Polish (2.4%, a difference of 0.080%), and Immigrants from Austria (2.4%, a difference of 0.10%).
| Demographics | Rating | Rank | Self-Care Disability |
| Colombians | 89.7 /100 | #127 | Excellent 2.4% |
| Immigrants from Hungary | 89.6 /100 | #128 | Excellent 2.4% |
| Immigrants from Romania | 89.3 /100 | #129 | Excellent 2.4% |
| Immigrants from Austria | 89.0 /100 | #130 | Excellent 2.4% |
| Poles | 88.9 /100 | #131 | Excellent 2.4% |
| Immigrants from South America | 88.8 /100 | #132 | Excellent 2.4% |
| Immigrants from Colombia | 88.5 /100 | #133 | Excellent 2.4% |
| Russians | 88.2 /100 | #134 | Excellent 2.4% |
| Laotians | 87.8 /100 | #135 | Excellent 2.4% |
| South American Indians | 87.2 /100 | #136 | Excellent 2.4% |
| Austrians | 87.0 /100 | #137 | Excellent 2.4% |
| Immigrants from Croatia | 86.6 /100 | #138 | Excellent 2.4% |
| Sri Lankans | 86.6 /100 | #139 | Excellent 2.4% |
| Immigrants from Uruguay | 85.4 /100 | #140 | Excellent 2.4% |
| Alaska Natives | 84.5 /100 | #141 | Excellent 2.4% |
Russian Self-Care Disability Correlation Summary
| Measurement | Russian Data | Self-Care Disability Data |
| Minimum | 0.22% | 1.2% |
| Maximum | 41.5% | 35.1% |
| Range | 41.3% | 33.9% |
| Mean | 15.7% | 4.3% |
| Median | 14.2% | 2.6% |
| Interquartile 25% (IQ1) | 7.2% | 2.2% |
| Interquartile 75% (IQ3) | 22.0% | 3.4% |
| Interquartile Range (IQR) | 14.8% | 1.2% |
| Standard Deviation (Sample) | 10.6% | 6.1% |
| Standard Deviation (Population) | 10.5% | 6.1% |
Correlation Details
| Russian Percentile | Sample Size | Self-Care Disability |
[ 0.0% - 0.5% ] 0.22% | 235,125,966 | 2.7% |
[ 0.5% - 1.0% ] 0.67% | 126,882,080 | 2.4% |
[ 1.0% - 1.5% ] 1.12% | 58,965,107 | 2.3% |
[ 1.5% - 2.0% ] 1.60% | 36,073,619 | 2.3% |
[ 2.0% - 2.5% ] 2.07% | 24,949,689 | 2.5% |
[ 2.5% - 3.0% ] 2.51% | 8,376,671 | 2.1% |
[ 2.5% - 3.0% ] 2.98% | 5,651,186 | 2.2% |
[ 3.0% - 3.5% ] 3.44% | 3,322,732 | 2.1% |
[ 3.5% - 4.0% ] 3.92% | 2,457,579 | 2.3% |
[ 4.0% - 4.5% ] 4.34% | 2,278,850 | 2.3% |
[ 4.5% - 5.0% ] 4.82% | 1,256,586 | 2.3% |
[ 5.0% - 5.5% ] 5.30% | 1,310,351 | 2.5% |
[ 5.5% - 6.0% ] 5.73% | 743,173 | 2.4% |
[ 6.0% - 6.5% ] 6.23% | 775,863 | 2.2% |
[ 6.5% - 7.0% ] 6.71% | 624,480 | 2.4% |
[ 7.0% - 7.5% ] 7.18% | 387,254 | 2.7% |
[ 7.5% - 8.0% ] 7.63% | 463,543 | 2.9% |
[ 8.0% - 8.5% ] 8.08% | 295,004 | 2.5% |
[ 8.0% - 8.5% ] 8.50% | 118,410 | 3.2% |
[ 8.5% - 9.0% ] 8.91% | 224,128 | 2.2% |
[ 9.0% - 9.5% ] 9.39% | 146,771 | 2.4% |
[ 9.5% - 10.0% ] 9.80% | 80,362 | 5.5% |
[ 10.0% - 10.5% ] 10.39% | 61,714 | 1.8% |
[ 10.5% - 11.0% ] 10.87% | 27,672 | 3.6% |
[ 11.0% - 11.5% ] 11.29% | 28,184 | 2.6% |
[ 11.5% - 12.0% ] 11.76% | 13,448 | 2.0% |
[ 12.0% - 12.5% ] 12.06% | 31,866 | 2.8% |
[ 12.5% - 13.0% ] 12.54% | 4,451 | 2.1% |
[ 12.5% - 13.0% ] 12.93% | 14,035 | 3.4% |
[ 13.5% - 14.0% ] 13.65% | 4,529 | 3.8% |
[ 14.0% - 14.5% ] 14.00% | 15,806 | 3.6% |
[ 14.0% - 14.5% ] 14.45% | 13,455 | 2.7% |
[ 15.0% - 15.5% ] 15.08% | 7,426 | 3.4% |
[ 15.0% - 15.5% ] 15.48% | 1,395 | 4.7% |
[ 15.5% - 16.0% ] 15.81% | 5,237 | 2.8% |
[ 16.0% - 16.5% ] 16.30% | 2,607 | 3.1% |
[ 16.5% - 17.0% ] 16.83% | 4,861 | 1.4% |
[ 17.0% - 17.5% ] 17.31% | 2,525 | 5.2% |
[ 17.5% - 18.0% ] 17.60% | 83,069 | 6.7% |
[ 18.0% - 18.5% ] 18.11% | 370 | 2.8% |
[ 18.5% - 19.0% ] 18.61% | 2,289 | 2.9% |
[ 19.5% - 20.0% ] 19.83% | 237 | 1.4% |
[ 20.0% - 20.5% ] 20.21% | 2,108 | 1.2% |
[ 20.0% - 20.5% ] 20.47% | 2,428 | 9.0% |
[ 20.5% - 21.0% ] 20.90% | 842 | 2.2% |
[ 21.0% - 21.5% ] 21.37% | 510 | 2.7% |
[ 21.5% - 22.0% ] 21.99% | 423 | 3.8% |
[ 22.0% - 22.5% ] 22.33% | 2,517 | 6.3% |
[ 23.0% - 23.5% ] 23.47% | 98 | 5.1% |
[ 23.5% - 24.0% ] 23.95% | 526 | 2.0% |
[ 26.0% - 26.5% ] 26.35% | 353 | 1.5% |
[ 26.5% - 27.0% ] 26.92% | 78 | 21.8% |
[ 28.5% - 29.0% ] 28.89% | 90 | 3.3% |
[ 29.0% - 29.5% ] 29.23% | 1,683 | 2.0% |
[ 31.0% - 31.5% ] 31.13% | 681 | 2.1% |
[ 32.0% - 32.5% ] 32.12% | 137 | 1.5% |
[ 32.5% - 33.0% ] 32.61% | 92 | 32.6% |
[ 33.5% - 34.0% ] 33.54% | 319 | 5.3% |
[ 34.5% - 35.0% ] 34.87% | 238 | 3.4% |
[ 35.0% - 35.5% ] 35.14% | 74 | 35.1% |
[ 38.5% - 39.0% ] 38.95% | 267 | 2.2% |
[ 41.0% - 41.5% ] 41.49% | 94 | 3.2% |