Russian 1 or more Vehicles in Household
COMPARE
Russian
Select to Compare
1 or more Vehicles in Household
Russian 1 or more Vehicles in Household
88.7%
1+ VEHICLES AVAILABLE
5.0/ 100
METRIC RATING
231st/ 347
METRIC RANK
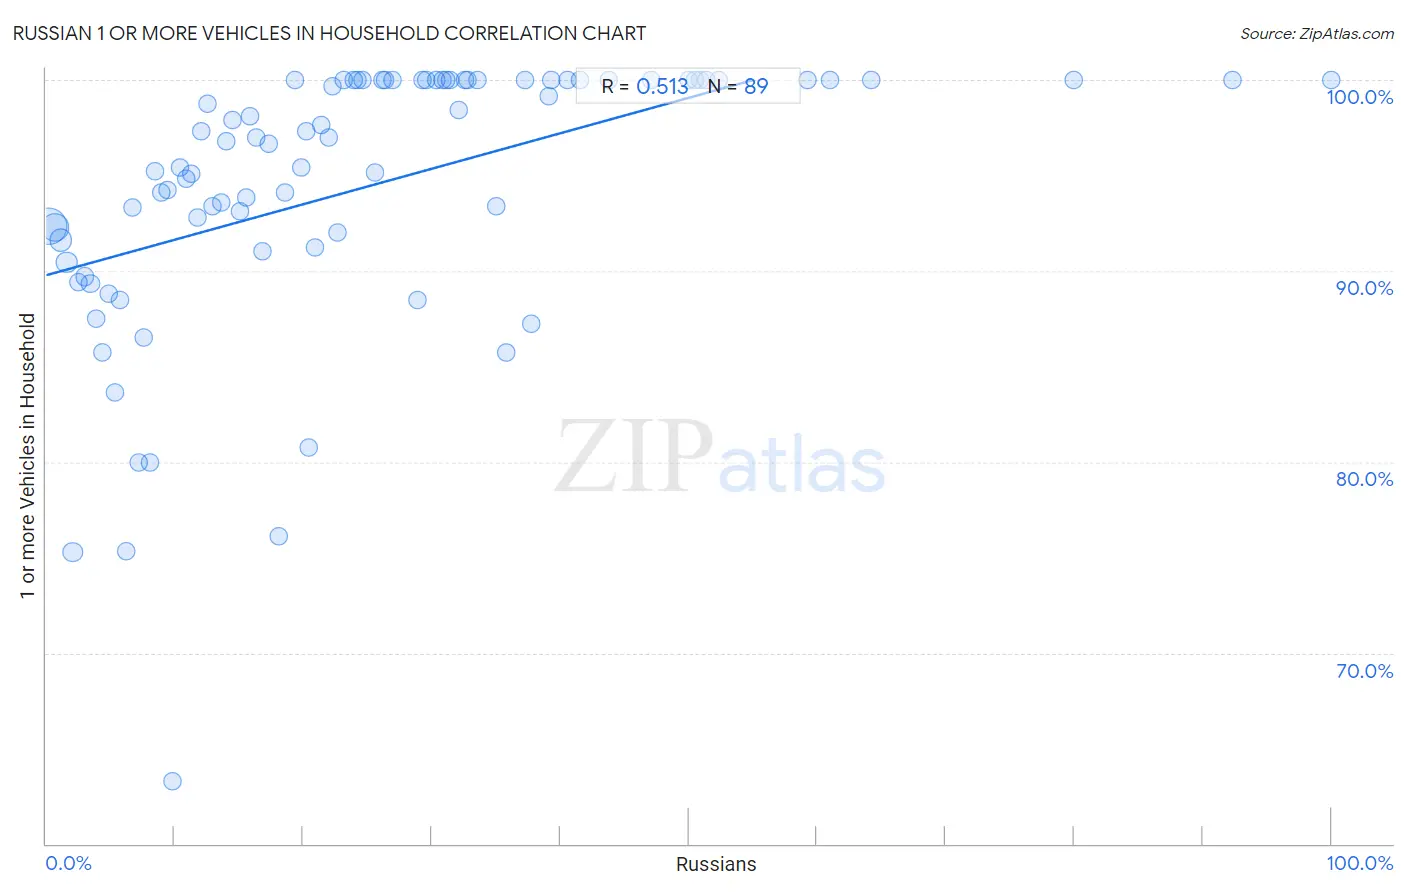
Russian 1 or more Vehicles in Household Correlation Chart
The statistical analysis conducted on geographies consisting of 511,739,915 people shows a substantial positive correlation between the proportion of Russians and percentage of households with 1 or more vehicles available in the United States with a correlation coefficient (R) of 0.513 and weighted average of 88.7%. On average, for every 1% (one percent) increase in Russians within a typical geography, there is an increase of 0.19% in percentage of households with 1 or more vehicles available.
It is essential to understand that the correlation between the percentage of Russians and percentage of households with 1 or more vehicles available does not imply a direct cause-and-effect relationship. It remains uncertain whether the presence of Russians influences an upward or downward trend in the level of percentage of households with 1 or more vehicles available within an area, or if Russians simply ended up residing in those areas with higher or lower levels of percentage of households with 1 or more vehicles available due to other factors.
Demographics Similar to Russians by 1 or more Vehicles in Household
In terms of 1 or more vehicles in household, the demographic groups most similar to Russians are Immigrants from Japan (88.7%, a difference of 0.0%), Immigrants from Sierra Leone (88.7%, a difference of 0.020%), Houma (88.6%, a difference of 0.020%), Immigrants from Romania (88.7%, a difference of 0.030%), and Immigrants from Peru (88.6%, a difference of 0.030%).
| Demographics | Rating | Rank | 1 or more Vehicles in Household |
| Immigrants from Hong Kong | 6.2 /100 | #224 | Tragic 88.7% |
| Cree | 6.0 /100 | #225 | Tragic 88.7% |
| Cheyenne | 5.7 /100 | #226 | Tragic 88.7% |
| Ute | 5.6 /100 | #227 | Tragic 88.7% |
| Immigrants from Norway | 5.5 /100 | #228 | Tragic 88.7% |
| Immigrants from Romania | 5.4 /100 | #229 | Tragic 88.7% |
| Immigrants from Sierra Leone | 5.2 /100 | #230 | Tragic 88.7% |
| Russians | 5.0 /100 | #231 | Tragic 88.7% |
| Immigrants from Japan | 4.9 /100 | #232 | Tragic 88.7% |
| Houma | 4.8 /100 | #233 | Tragic 88.6% |
| Immigrants from Peru | 4.7 /100 | #234 | Tragic 88.6% |
| Paiute | 4.6 /100 | #235 | Tragic 88.6% |
| Immigrants from Pakistan | 4.5 /100 | #236 | Tragic 88.6% |
| Immigrants from Turkey | 4.4 /100 | #237 | Tragic 88.6% |
| Immigrants from Somalia | 4.2 /100 | #238 | Tragic 88.6% |
Russian 1 or more Vehicles in Household Correlation Summary
| Measurement | Russian Data | 1 or more Vehicles in Household Data |
| Minimum | 0.22% | 63.3% |
| Maximum | 100.0% | 100.0% |
| Range | 99.8% | 36.7% |
| Mean | 24.8% | 94.4% |
| Median | 20.9% | 97.0% |
| Interquartile 25% (IQ1) | 10.1% | 91.4% |
| Interquartile 75% (IQ3) | 33.2% | 100.0% |
| Interquartile Range (IQR) | 23.1% | 8.6% |
| Standard Deviation (Sample) | 19.8% | 7.2% |
| Standard Deviation (Population) | 19.7% | 7.1% |
Correlation Details
| Russian Percentile | Sample Size | 1 or more Vehicles in Household |
[ 0.0% - 0.5% ] 0.22% | 235,338,089 | 92.4% |
[ 0.5% - 1.0% ] 0.67% | 127,073,823 | 92.3% |
[ 1.0% - 1.5% ] 1.12% | 59,110,055 | 91.6% |
[ 1.5% - 2.0% ] 1.60% | 36,176,513 | 90.4% |
[ 2.0% - 2.5% ] 2.07% | 24,987,294 | 75.3% |
[ 2.5% - 3.0% ] 2.51% | 8,409,732 | 89.4% |
[ 2.5% - 3.0% ] 2.98% | 5,718,970 | 89.7% |
[ 3.0% - 3.5% ] 3.44% | 3,358,227 | 89.3% |
[ 3.5% - 4.0% ] 3.92% | 2,491,313 | 87.5% |
[ 4.0% - 4.5% ] 4.34% | 2,292,444 | 85.7% |
[ 4.5% - 5.0% ] 4.82% | 1,276,372 | 88.8% |
[ 5.0% - 5.5% ] 5.30% | 1,319,913 | 83.6% |
[ 5.5% - 6.0% ] 5.73% | 753,727 | 88.5% |
[ 6.0% - 6.5% ] 6.23% | 785,806 | 75.3% |
[ 6.5% - 7.0% ] 6.71% | 630,176 | 93.3% |
[ 7.0% - 7.5% ] 7.18% | 392,798 | 80.0% |
[ 7.5% - 8.0% ] 7.63% | 465,483 | 86.5% |
[ 8.0% - 8.5% ] 8.08% | 297,545 | 80.0% |
[ 8.0% - 8.5% ] 8.49% | 120,824 | 95.2% |
[ 8.5% - 9.0% ] 8.92% | 226,952 | 94.1% |
[ 9.0% - 9.5% ] 9.39% | 151,653 | 94.2% |
[ 9.5% - 10.0% ] 9.80% | 88,719 | 63.3% |
[ 10.0% - 10.5% ] 10.39% | 62,565 | 95.4% |
[ 10.5% - 11.0% ] 10.88% | 28,302 | 94.9% |
[ 11.0% - 11.5% ] 11.29% | 28,675 | 95.1% |
[ 11.5% - 12.0% ] 11.76% | 14,718 | 92.8% |
[ 12.0% - 12.5% ] 12.07% | 32,719 | 97.3% |
[ 12.5% - 13.0% ] 12.54% | 4,475 | 98.8% |
[ 12.5% - 13.0% ] 12.93% | 14,112 | 93.4% |
[ 13.5% - 14.0% ] 13.65% | 4,088 | 93.6% |
[ 14.0% - 14.5% ] 14.01% | 17,649 | 96.8% |
[ 14.0% - 14.5% ] 14.45% | 13,935 | 97.9% |
[ 15.0% - 15.5% ] 15.08% | 7,559 | 93.1% |
[ 15.5% - 16.0% ] 15.54% | 2,065 | 93.8% |
[ 15.5% - 16.0% ] 15.82% | 5,555 | 98.1% |
[ 16.0% - 16.5% ] 16.31% | 3,096 | 97.0% |
[ 16.5% - 17.0% ] 16.83% | 4,903 | 91.1% |
[ 17.0% - 17.5% ] 17.31% | 2,606 | 96.6% |
[ 18.0% - 18.5% ] 18.10% | 569 | 76.1% |
[ 18.5% - 19.0% ] 18.61% | 2,364 | 94.1% |
[ 19.0% - 19.5% ] 19.35% | 31 | 100.0% |
[ 19.5% - 20.0% ] 19.83% | 237 | 95.4% |
[ 20.0% - 20.5% ] 20.23% | 2,640 | 97.3% |
[ 20.0% - 20.5% ] 20.46% | 3,186 | 80.7% |
[ 20.5% - 21.0% ] 20.92% | 980 | 91.2% |
[ 21.0% - 21.5% ] 21.36% | 618 | 97.7% |
[ 21.5% - 22.0% ] 21.96% | 510 | 97.0% |
[ 22.0% - 22.5% ] 22.32% | 2,943 | 99.7% |
[ 22.5% - 23.0% ] 22.68% | 291 | 92.0% |
[ 23.0% - 23.5% ] 23.19% | 789 | 100.0% |
[ 23.5% - 24.0% ] 23.93% | 610 | 100.0% |
[ 24.0% - 24.5% ] 24.21% | 318 | 100.0% |
[ 24.5% - 25.0% ] 24.57% | 867 | 100.0% |
[ 25.5% - 26.0% ] 25.57% | 395 | 95.2% |
[ 26.0% - 26.5% ] 26.21% | 847 | 100.0% |
[ 26.0% - 26.5% ] 26.35% | 353 | 100.0% |
[ 26.5% - 27.0% ] 26.92% | 78 | 100.0% |
[ 28.5% - 29.0% ] 28.89% | 90 | 88.5% |
[ 29.0% - 29.5% ] 29.23% | 1,683 | 100.0% |
[ 29.5% - 30.0% ] 29.55% | 44 | 100.0% |
[ 30.0% - 30.5% ] 30.30% | 462 | 100.0% |
[ 30.5% - 31.0% ] 30.83% | 120 | 100.0% |
[ 31.0% - 31.5% ] 31.13% | 681 | 100.0% |
[ 31.0% - 31.5% ] 31.43% | 70 | 100.0% |
[ 32.0% - 32.5% ] 32.13% | 305 | 98.5% |
[ 32.5% - 33.0% ] 32.61% | 92 | 100.0% |
[ 32.5% - 33.0% ] 32.80% | 503 | 100.0% |
[ 33.5% - 34.0% ] 33.54% | 319 | 100.0% |
[ 34.5% - 35.0% ] 35.00% | 640 | 93.4% |
[ 35.5% - 36.0% ] 35.79% | 95 | 85.7% |
[ 37.0% - 37.5% ] 37.21% | 129 | 100.0% |
[ 37.5% - 38.0% ] 37.74% | 106 | 87.3% |
[ 39.0% - 39.5% ] 39.12% | 979 | 99.1% |
[ 39.0% - 39.5% ] 39.32% | 234 | 100.0% |
[ 40.5% - 41.0% ] 40.56% | 143 | 100.0% |
[ 41.0% - 41.5% ] 41.49% | 94 | 100.0% |
[ 43.5% - 44.0% ] 43.75% | 16 | 100.0% |
[ 47.0% - 47.5% ] 47.06% | 51 | 100.0% |
[ 50.0% - 50.5% ] 50.00% | 8 | 100.0% |
[ 50.0% - 50.5% ] 50.50% | 202 | 100.0% |
[ 50.5% - 51.0% ] 50.90% | 167 | 100.0% |
[ 51.0% - 51.5% ] 51.39% | 72 | 100.0% |
[ 52.0% - 52.5% ] 52.38% | 105 | 100.0% |
[ 59.0% - 59.5% ] 59.26% | 27 | 100.0% |
[ 61.0% - 61.5% ] 61.04% | 77 | 100.0% |
[ 64.0% - 64.5% ] 64.23% | 274 | 100.0% |
[ 80.0% - 80.5% ] 80.00% | 10 | 100.0% |
[ 92.0% - 92.5% ] 92.31% | 13 | 100.0% |
[ 99.5% - 100.0% ] 100.00% | 28 | 100.0% |