Nicaraguan Wage/Income Gap
COMPARE
Nicaraguan
Select to Compare
Wage/Income Gap
Nicaraguan Wage/Income Gap
23.4%
WAGE/INCOME GAP
99.6/ 100
METRIC RATING
90th/ 347
METRIC RANK
Nicaraguan Wage/Income Gap Correlation Chart
The statistical analysis conducted on geographies consisting of 285,636,386 people shows a poor positive correlation between the proportion of Nicaraguans and wage/income gap percentage in the United States with a correlation coefficient (R) of 0.104 and weighted average of 23.4%. On average, for every 1% (one percent) increase in Nicaraguans within a typical geography, there is an increase of 0.17% in wage/income gap percentage.
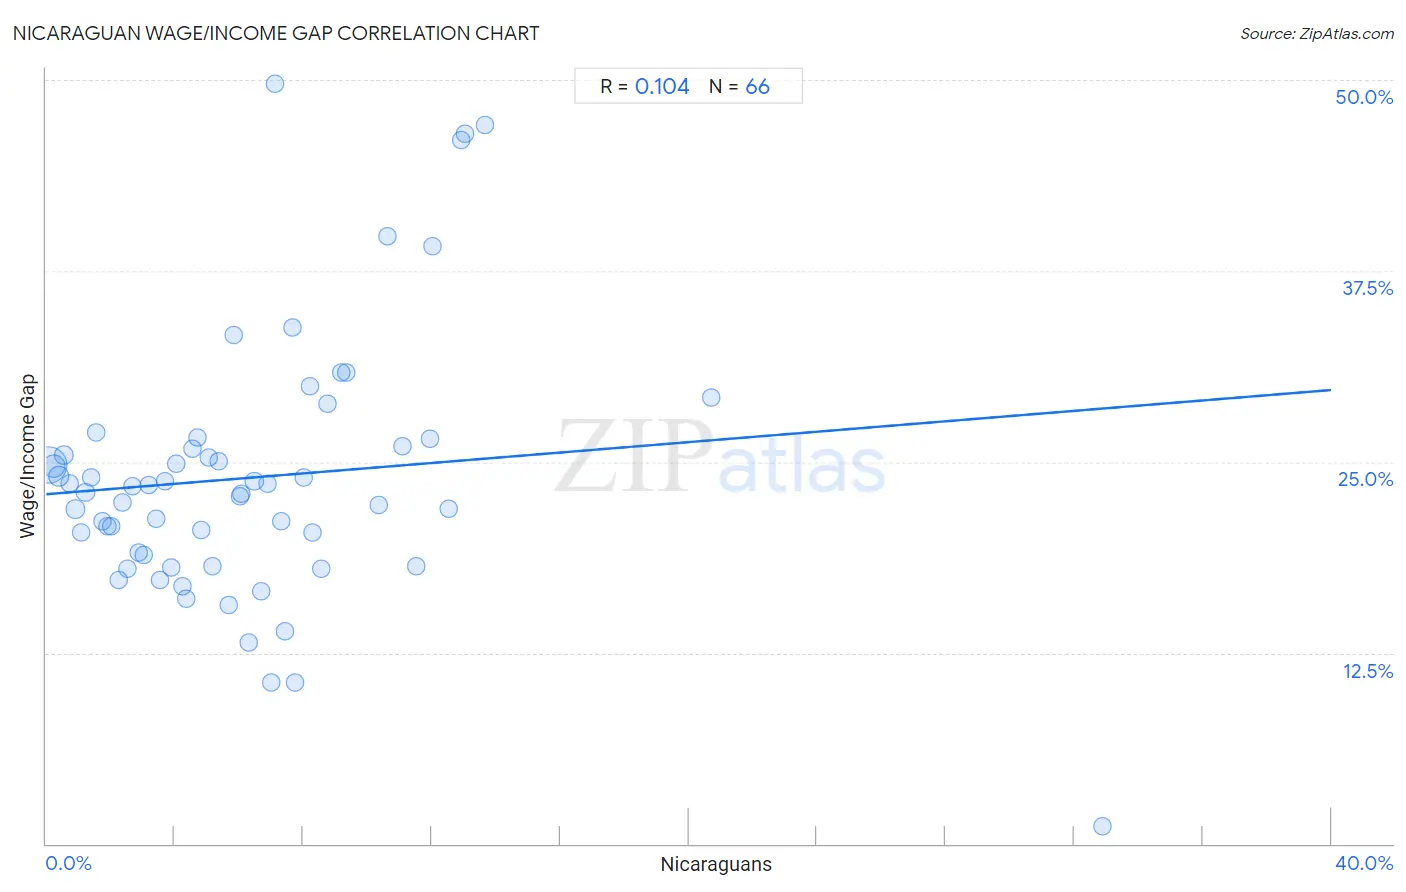
It is essential to understand that the correlation between the percentage of Nicaraguans and wage/income gap percentage does not imply a direct cause-and-effect relationship. It remains uncertain whether the presence of Nicaraguans influences an upward or downward trend in the level of wage/income gap percentage within an area, or if Nicaraguans simply ended up residing in those areas with higher or lower levels of wage/income gap percentage due to other factors.
Demographics Similar to Nicaraguans by Wage/Income Gap
In terms of wage/income gap, the demographic groups most similar to Nicaraguans are Marshallese (23.4%, a difference of 0.010%), Immigrants from Panama (23.4%, a difference of 0.10%), Arapaho (23.5%, a difference of 0.14%), Immigrants from Honduras (23.5%, a difference of 0.29%), and Yuman (23.3%, a difference of 0.42%).
| Demographics | Rating | Rank | Wage/Income Gap |
| Immigrants from Africa | 99.8 /100 | #83 | Exceptional 23.2% |
| Cubans | 99.7 /100 | #84 | Exceptional 23.3% |
| Immigrants from Cambodia | 99.7 /100 | #85 | Exceptional 23.3% |
| Cheyenne | 99.7 /100 | #86 | Exceptional 23.3% |
| Yuman | 99.7 /100 | #87 | Exceptional 23.3% |
| Immigrants from Panama | 99.6 /100 | #88 | Exceptional 23.4% |
| Marshallese | 99.6 /100 | #89 | Exceptional 23.4% |
| Nicaraguans | 99.6 /100 | #90 | Exceptional 23.4% |
| Arapaho | 99.6 /100 | #91 | Exceptional 23.5% |
| Immigrants from Honduras | 99.5 /100 | #92 | Exceptional 23.5% |
| Immigrants from Cabo Verde | 99.5 /100 | #93 | Exceptional 23.6% |
| Hondurans | 99.5 /100 | #94 | Exceptional 23.6% |
| Cape Verdeans | 99.4 /100 | #95 | Exceptional 23.6% |
| Kiowa | 99.4 /100 | #96 | Exceptional 23.6% |
| Immigrants from Sudan | 99.4 /100 | #97 | Exceptional 23.6% |
Nicaraguan Wage/Income Gap Correlation Summary
| Measurement | Nicaraguan Data | Wage/Income Gap Data |
| Minimum | 0.071% | 1.2% |
| Maximum | 32.9% | 49.8% |
| Range | 32.8% | 48.6% |
| Mean | 6.3% | 24.0% |
| Median | 5.5% | 23.2% |
| Interquartile 25% (IQ1) | 2.7% | 18.9% |
| Interquartile 75% (IQ3) | 8.3% | 26.0% |
| Interquartile Range (IQR) | 5.6% | 7.1% |
| Standard Deviation (Sample) | 5.3% | 8.6% |
| Standard Deviation (Population) | 5.2% | 8.5% |
Correlation Details
| Nicaraguan Percentile | Sample Size | Wage/Income Gap |
[ 0.0% - 0.5% ] 0.071% | 178,758,672 | 24.8% |
[ 0.0% - 0.5% ] 0.24% | 49,090,262 | 24.7% |
[ 0.0% - 0.5% ] 0.40% | 23,746,184 | 24.1% |
[ 0.5% - 1.0% ] 0.56% | 9,793,850 | 25.4% |
[ 0.5% - 1.0% ] 0.73% | 5,904,294 | 23.6% |
[ 0.5% - 1.0% ] 0.90% | 4,641,861 | 21.9% |
[ 1.0% - 1.5% ] 1.07% | 2,205,053 | 20.4% |
[ 1.0% - 1.5% ] 1.22% | 2,073,023 | 23.0% |
[ 1.0% - 1.5% ] 1.39% | 1,566,006 | 23.9% |
[ 1.5% - 2.0% ] 1.56% | 1,005,571 | 26.9% |
[ 1.5% - 2.0% ] 1.74% | 471,533 | 21.1% |
[ 1.5% - 2.0% ] 1.89% | 914,689 | 20.8% |
[ 2.0% - 2.5% ] 2.04% | 427,526 | 20.8% |
[ 2.0% - 2.5% ] 2.24% | 500,382 | 17.2% |
[ 2.0% - 2.5% ] 2.36% | 411,420 | 22.3% |
[ 2.5% - 3.0% ] 2.53% | 411,448 | 18.0% |
[ 2.5% - 3.0% ] 2.67% | 188,531 | 23.4% |
[ 2.5% - 3.0% ] 2.88% | 128,439 | 19.1% |
[ 3.0% - 3.5% ] 3.05% | 53,386 | 18.9% |
[ 3.0% - 3.5% ] 3.20% | 217,461 | 23.5% |
[ 3.0% - 3.5% ] 3.41% | 112,426 | 21.3% |
[ 3.5% - 4.0% ] 3.53% | 267,119 | 17.2% |
[ 3.5% - 4.0% ] 3.69% | 72,794 | 23.7% |
[ 3.5% - 4.0% ] 3.88% | 161,180 | 18.1% |
[ 4.0% - 4.5% ] 4.06% | 121,587 | 24.9% |
[ 4.0% - 4.5% ] 4.25% | 57,033 | 16.8% |
[ 4.0% - 4.5% ] 4.36% | 150,561 | 16.0% |
[ 4.5% - 5.0% ] 4.54% | 381,917 | 25.8% |
[ 4.5% - 5.0% ] 4.69% | 81,385 | 26.6% |
[ 4.5% - 5.0% ] 4.84% | 52,719 | 20.6% |
[ 5.0% - 5.5% ] 5.08% | 34,057 | 25.3% |
[ 5.0% - 5.5% ] 5.18% | 80,975 | 18.2% |
[ 5.0% - 5.5% ] 5.37% | 39,581 | 25.1% |
[ 5.5% - 6.0% ] 5.66% | 72,849 | 15.6% |
[ 5.5% - 6.0% ] 5.85% | 49,851 | 33.3% |
[ 6.0% - 6.5% ] 6.02% | 82,658 | 22.8% |
[ 6.0% - 6.5% ] 6.09% | 59,115 | 22.9% |
[ 6.0% - 6.5% ] 6.32% | 94,134 | 13.2% |
[ 6.0% - 6.5% ] 6.48% | 443,665 | 23.7% |
[ 6.5% - 7.0% ] 6.69% | 81,226 | 16.5% |
[ 6.5% - 7.0% ] 6.88% | 1,018 | 23.6% |
[ 7.0% - 7.5% ] 7.00% | 14,957 | 10.5% |
[ 7.0% - 7.5% ] 7.12% | 1,194 | 49.8% |
[ 7.0% - 7.5% ] 7.32% | 18,719 | 21.1% |
[ 7.0% - 7.5% ] 7.42% | 58,131 | 13.9% |
[ 7.5% - 8.0% ] 7.65% | 35,034 | 33.8% |
[ 7.5% - 8.0% ] 7.75% | 284 | 10.6% |
[ 8.0% - 8.5% ] 8.01% | 101,807 | 24.0% |
[ 8.0% - 8.5% ] 8.21% | 1,194 | 30.0% |
[ 8.0% - 8.5% ] 8.27% | 73,842 | 20.4% |
[ 8.5% - 9.0% ] 8.58% | 46,123 | 18.0% |
[ 8.5% - 9.0% ] 8.74% | 14,698 | 28.8% |
[ 9.0% - 9.5% ] 9.19% | 59,121 | 30.9% |
[ 9.0% - 9.5% ] 9.33% | 34,335 | 30.8% |
[ 10.0% - 10.5% ] 10.36% | 2,549 | 22.2% |
[ 10.5% - 11.0% ] 10.62% | 1,083 | 39.7% |
[ 11.0% - 11.5% ] 11.07% | 867 | 26.0% |
[ 11.5% - 12.0% ] 11.53% | 34,742 | 18.2% |
[ 11.5% - 12.0% ] 11.93% | 40,278 | 26.5% |
[ 12.0% - 12.5% ] 12.03% | 582 | 39.1% |
[ 12.5% - 13.0% ] 12.54% | 54,873 | 22.0% |
[ 12.5% - 13.0% ] 12.92% | 12,069 | 46.0% |
[ 13.0% - 13.5% ] 13.02% | 630 | 46.5% |
[ 13.5% - 14.0% ] 13.65% | 740 | 47.1% |
[ 20.5% - 21.0% ] 20.70% | 19,399 | 29.2% |
[ 32.5% - 33.0% ] 32.88% | 1,694 | 1.2% |