Nicaraguan Unemployment Among Women with Children Ages 6 to 17 years
COMPARE
Nicaraguan
Select to Compare
Unemployment Among Women with Children Ages 6 to 17 years
Nicaraguan Unemployment Among Women with Children Ages 6 to 17 years
9.4%
UNEMPLOYMENT | WOMEN W/ CHILDREN 6 TO 17
1.0/ 100
METRIC RATING
254th/ 347
METRIC RANK
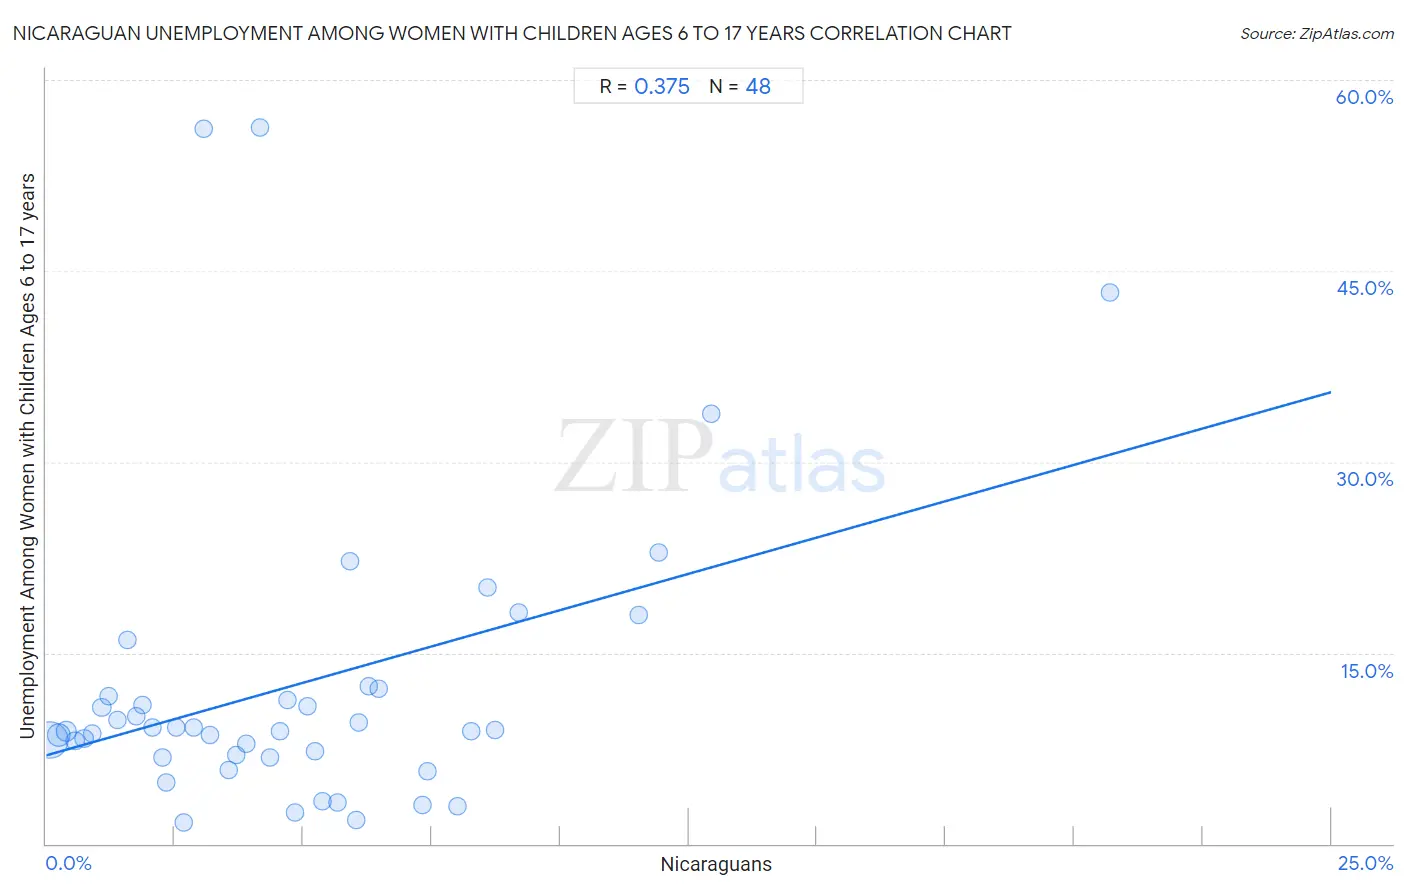
Nicaraguan Unemployment Among Women with Children Ages 6 to 17 years Correlation Chart
The statistical analysis conducted on geographies consisting of 225,411,193 people shows a mild positive correlation between the proportion of Nicaraguans and unemployment rate among women with children between the ages 6 and 17 in the United States with a correlation coefficient (R) of 0.375 and weighted average of 9.4%. On average, for every 1% (one percent) increase in Nicaraguans within a typical geography, there is an increase of 1.1% in unemployment rate among women with children between the ages 6 and 17.
It is essential to understand that the correlation between the percentage of Nicaraguans and unemployment rate among women with children between the ages 6 and 17 does not imply a direct cause-and-effect relationship. It remains uncertain whether the presence of Nicaraguans influences an upward or downward trend in the level of unemployment rate among women with children between the ages 6 and 17 within an area, or if Nicaraguans simply ended up residing in those areas with higher or lower levels of unemployment rate among women with children between the ages 6 and 17 due to other factors.
Demographics Similar to Nicaraguans by Unemployment Among Women with Children Ages 6 to 17 years
In terms of unemployment among women with children ages 6 to 17 years, the demographic groups most similar to Nicaraguans are Lithuanian (9.4%, a difference of 0.060%), Portuguese (9.4%, a difference of 0.17%), Canadian (9.4%, a difference of 0.23%), Creek (9.4%, a difference of 0.26%), and Celtic (9.5%, a difference of 0.26%).
| Demographics | Rating | Rank | Unemployment Among Women with Children Ages 6 to 17 years |
| Poles | 1.5 /100 | #247 | Tragic 9.4% |
| Dutch | 1.5 /100 | #248 | Tragic 9.4% |
| Immigrants from South America | 1.5 /100 | #249 | Tragic 9.4% |
| Immigrants from Guatemala | 1.3 /100 | #250 | Tragic 9.4% |
| Central Americans | 1.3 /100 | #251 | Tragic 9.4% |
| Creek | 1.2 /100 | #252 | Tragic 9.4% |
| Portuguese | 1.1 /100 | #253 | Tragic 9.4% |
| Nicaraguans | 1.0 /100 | #254 | Tragic 9.4% |
| Lithuanians | 0.9 /100 | #255 | Tragic 9.4% |
| Canadians | 0.8 /100 | #256 | Tragic 9.4% |
| Celtics | 0.7 /100 | #257 | Tragic 9.5% |
| Immigrants from Mexico | 0.7 /100 | #258 | Tragic 9.5% |
| Immigrants from Central America | 0.6 /100 | #259 | Tragic 9.5% |
| Italians | 0.6 /100 | #260 | Tragic 9.5% |
| South Americans | 0.5 /100 | #261 | Tragic 9.5% |
Nicaraguan Unemployment Among Women with Children Ages 6 to 17 years Correlation Summary
| Measurement | Nicaraguan Data | Unemployment Among Women with Children Ages 6 to 17 years Data |
| Minimum | 0.071% | 1.6% |
| Maximum | 20.7% | 56.3% |
| Range | 20.6% | 54.7% |
| Mean | 4.9% | 12.5% |
| Median | 4.3% | 8.9% |
| Interquartile 25% (IQ1) | 2.0% | 6.9% |
| Interquartile 75% (IQ3) | 6.4% | 11.9% |
| Interquartile Range (IQR) | 4.4% | 5.0% |
| Standard Deviation (Sample) | 3.9% | 12.0% |
| Standard Deviation (Population) | 3.9% | 11.9% |
Correlation Details
| Nicaraguan Percentile | Sample Size | Unemployment Among Women with Children Ages 6 to 17 years |
[ 0.0% - 0.5% ] 0.071% | 145,214,134 | 8.2% |
[ 0.0% - 0.5% ] 0.24% | 37,908,809 | 8.6% |
[ 0.0% - 0.5% ] 0.40% | 18,664,529 | 8.9% |
[ 0.5% - 1.0% ] 0.56% | 6,874,761 | 8.1% |
[ 0.5% - 1.0% ] 0.74% | 3,930,595 | 8.3% |
[ 0.5% - 1.0% ] 0.90% | 3,589,918 | 8.7% |
[ 1.0% - 1.5% ] 1.08% | 1,486,184 | 10.7% |
[ 1.0% - 1.5% ] 1.22% | 1,675,461 | 11.6% |
[ 1.0% - 1.5% ] 1.39% | 1,128,508 | 9.7% |
[ 1.5% - 2.0% ] 1.57% | 680,035 | 16.1% |
[ 1.5% - 2.0% ] 1.74% | 362,704 | 10.0% |
[ 1.5% - 2.0% ] 1.87% | 413,630 | 10.9% |
[ 2.0% - 2.5% ] 2.06% | 133,949 | 9.2% |
[ 2.0% - 2.5% ] 2.25% | 334,934 | 6.8% |
[ 2.0% - 2.5% ] 2.34% | 220,941 | 4.8% |
[ 2.5% - 3.0% ] 2.54% | 201,684 | 9.1% |
[ 2.5% - 3.0% ] 2.68% | 123,166 | 1.6% |
[ 2.5% - 3.0% ] 2.87% | 80,786 | 9.1% |
[ 3.0% - 3.5% ] 3.06% | 16,449 | 56.2% |
[ 3.0% - 3.5% ] 3.19% | 172,880 | 8.5% |
[ 3.5% - 4.0% ] 3.54% | 174,111 | 5.7% |
[ 3.5% - 4.0% ] 3.71% | 54,922 | 7.0% |
[ 3.5% - 4.0% ] 3.88% | 135,013 | 7.9% |
[ 4.0% - 4.5% ] 4.17% | 4,175 | 56.3% |
[ 4.0% - 4.5% ] 4.36% | 150,561 | 6.8% |
[ 4.5% - 5.0% ] 4.54% | 335,564 | 8.9% |
[ 4.5% - 5.0% ] 4.69% | 81,069 | 11.3% |
[ 4.5% - 5.0% ] 4.84% | 52,719 | 2.5% |
[ 5.0% - 5.5% ] 5.08% | 34,057 | 10.8% |
[ 5.0% - 5.5% ] 5.22% | 52,661 | 7.3% |
[ 5.0% - 5.5% ] 5.37% | 37,977 | 3.3% |
[ 5.5% - 6.0% ] 5.66% | 52,851 | 3.2% |
[ 5.5% - 6.0% ] 5.90% | 32,946 | 22.2% |
[ 6.0% - 6.5% ] 6.04% | 59,843 | 1.9% |
[ 6.0% - 6.5% ] 6.08% | 37,954 | 9.5% |
[ 6.0% - 6.5% ] 6.27% | 9,863 | 12.4% |
[ 6.0% - 6.5% ] 6.48% | 443,665 | 12.2% |
[ 7.0% - 7.5% ] 7.32% | 18,719 | 3.0% |
[ 7.0% - 7.5% ] 7.41% | 47,065 | 5.7% |
[ 8.0% - 8.5% ] 8.01% | 100,985 | 2.9% |
[ 8.0% - 8.5% ] 8.26% | 57,066 | 8.8% |
[ 8.5% - 9.0% ] 8.58% | 46,123 | 20.1% |
[ 8.5% - 9.0% ] 8.74% | 14,698 | 8.9% |
[ 9.0% - 9.5% ] 9.19% | 59,121 | 18.2% |
[ 11.5% - 12.0% ] 11.53% | 34,742 | 18.0% |
[ 11.5% - 12.0% ] 11.93% | 40,278 | 22.9% |
[ 12.5% - 13.0% ] 12.93% | 8,989 | 33.8% |
[ 20.5% - 21.0% ] 20.70% | 19,399 | 43.3% |