Nicaraguan Married-Couple Family Poverty
COMPARE
Nicaraguan
Select to Compare
Married-Couple Family Poverty
Nicaraguan Married-Couple Family Poverty
6.7%
POVERTY | MARRIED-COUPLE FAMILIES
0.0/ 100
METRIC RATING
299th/ 347
METRIC RANK
Nicaraguan Married-Couple Family Poverty Correlation Chart
The statistical analysis conducted on geographies consisting of 284,450,167 people shows a mild positive correlation between the proportion of Nicaraguans and poverty level among married-couple families in the United States with a correlation coefficient (R) of 0.350 and weighted average of 6.7%. On average, for every 1% (one percent) increase in Nicaraguans within a typical geography, there is an increase of 0.35% in poverty level among married-couple families.
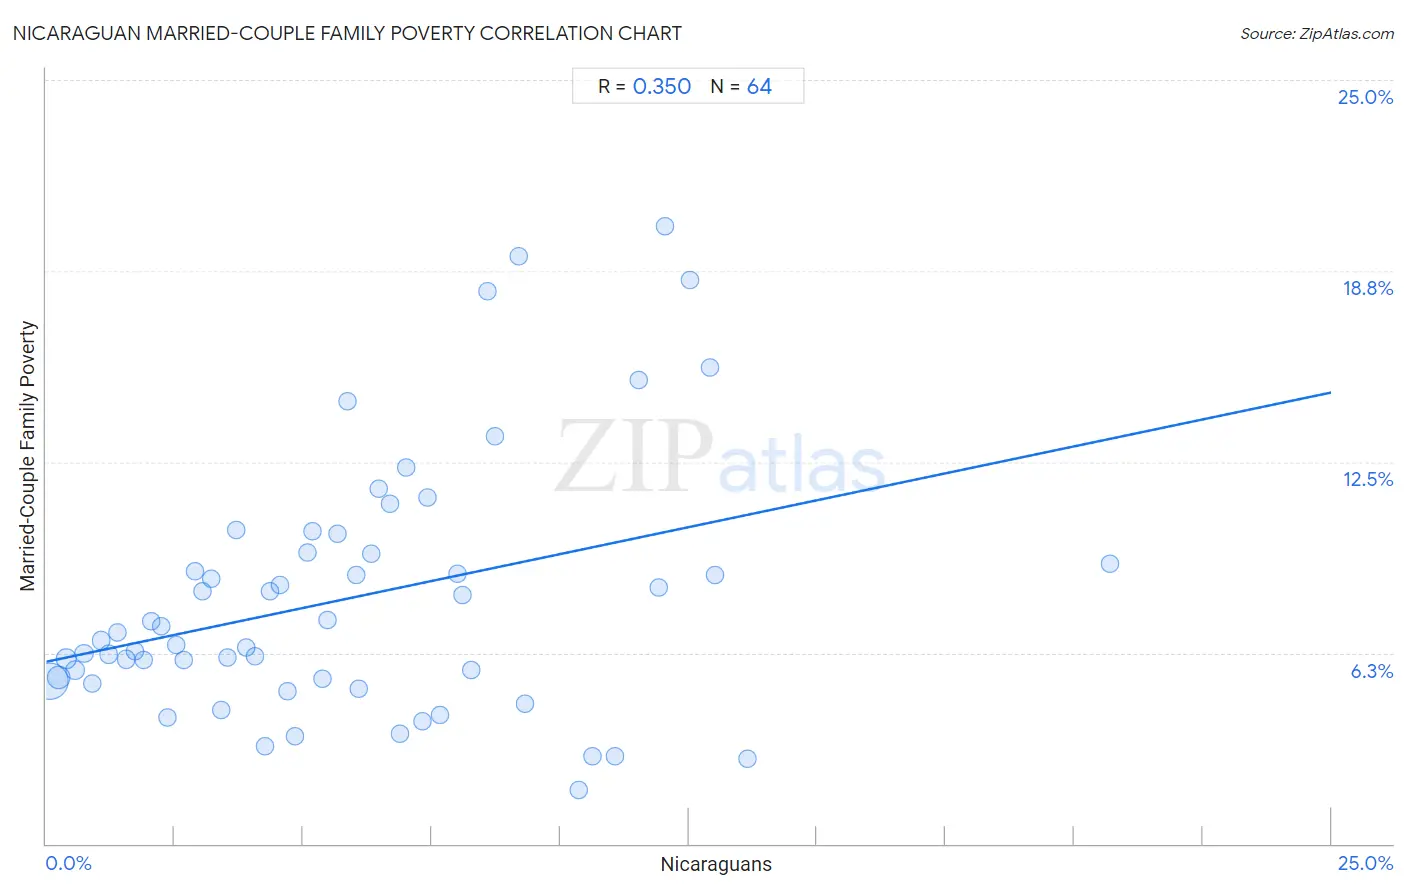
It is essential to understand that the correlation between the percentage of Nicaraguans and poverty level among married-couple families does not imply a direct cause-and-effect relationship. It remains uncertain whether the presence of Nicaraguans influences an upward or downward trend in the level of poverty level among married-couple families within an area, or if Nicaraguans simply ended up residing in those areas with higher or lower levels of poverty level among married-couple families due to other factors.
Demographics Similar to Nicaraguans by Married-Couple Family Poverty
In terms of married-couple family poverty, the demographic groups most similar to Nicaraguans are Immigrants from Belize (6.7%, a difference of 0.15%), Immigrants from Guyana (6.7%, a difference of 0.55%), Kiowa (6.6%, a difference of 0.61%), U.S. Virgin Islander (6.6%, a difference of 0.62%), and Immigrants from Uzbekistan (6.6%, a difference of 0.73%).
| Demographics | Rating | Rank | Married-Couple Family Poverty |
| Immigrants from Lebanon | 0.0 /100 | #292 | Tragic 6.6% |
| Arapaho | 0.0 /100 | #293 | Tragic 6.6% |
| Bahamians | 0.0 /100 | #294 | Tragic 6.6% |
| Immigrants from Uzbekistan | 0.0 /100 | #295 | Tragic 6.6% |
| U.S. Virgin Islanders | 0.0 /100 | #296 | Tragic 6.6% |
| Kiowa | 0.0 /100 | #297 | Tragic 6.6% |
| Immigrants from Guyana | 0.0 /100 | #298 | Tragic 6.7% |
| Nicaraguans | 0.0 /100 | #299 | Tragic 6.7% |
| Immigrants from Belize | 0.0 /100 | #300 | Tragic 6.7% |
| Central Americans | 0.0 /100 | #301 | Tragic 6.7% |
| Immigrants from Ecuador | 0.0 /100 | #302 | Tragic 6.7% |
| Immigrants from El Salvador | 0.0 /100 | #303 | Tragic 6.8% |
| Cubans | 0.0 /100 | #304 | Tragic 6.8% |
| Haitians | 0.0 /100 | #305 | Tragic 6.8% |
| Immigrants from Haiti | 0.0 /100 | #306 | Tragic 7.0% |
Nicaraguan Married-Couple Family Poverty Correlation Summary
| Measurement | Nicaraguan Data | Married-Couple Family Poverty Data |
| Minimum | 0.071% | 1.7% |
| Maximum | 20.7% | 20.2% |
| Range | 20.6% | 18.5% |
| Mean | 5.9% | 8.0% |
| Median | 5.3% | 6.8% |
| Interquartile 25% (IQ1) | 2.6% | 5.4% |
| Interquartile 75% (IQ3) | 8.2% | 9.5% |
| Interquartile Range (IQR) | 5.6% | 4.2% |
| Standard Deviation (Sample) | 4.1% | 4.2% |
| Standard Deviation (Population) | 4.1% | 4.1% |
Correlation Details
| Nicaraguan Percentile | Sample Size | Married-Couple Family Poverty |
[ 0.0% - 0.5% ] 0.071% | 178,401,084 | 5.3% |
[ 0.0% - 0.5% ] 0.24% | 48,794,841 | 5.5% |
[ 0.0% - 0.5% ] 0.40% | 23,606,437 | 6.1% |
[ 0.5% - 1.0% ] 0.56% | 9,615,863 | 5.7% |
[ 0.5% - 1.0% ] 0.73% | 5,852,054 | 6.2% |
[ 0.5% - 1.0% ] 0.90% | 4,621,227 | 5.2% |
[ 1.0% - 1.5% ] 1.07% | 2,193,058 | 6.7% |
[ 1.0% - 1.5% ] 1.22% | 2,070,844 | 6.2% |
[ 1.0% - 1.5% ] 1.39% | 1,542,390 | 6.9% |
[ 1.5% - 2.0% ] 1.56% | 977,976 | 6.0% |
[ 1.5% - 2.0% ] 1.74% | 465,290 | 6.3% |
[ 1.5% - 2.0% ] 1.89% | 899,472 | 6.0% |
[ 2.0% - 2.5% ] 2.04% | 420,014 | 7.3% |
[ 2.0% - 2.5% ] 2.24% | 488,746 | 7.1% |
[ 2.0% - 2.5% ] 2.36% | 386,006 | 4.1% |
[ 2.5% - 3.0% ] 2.53% | 411,448 | 6.5% |
[ 2.5% - 3.0% ] 2.67% | 193,398 | 6.0% |
[ 2.5% - 3.0% ] 2.88% | 128,152 | 8.9% |
[ 3.0% - 3.5% ] 3.05% | 54,414 | 8.3% |
[ 3.0% - 3.5% ] 3.20% | 216,984 | 8.7% |
[ 3.0% - 3.5% ] 3.41% | 111,207 | 4.4% |
[ 3.5% - 4.0% ] 3.53% | 266,359 | 6.1% |
[ 3.5% - 4.0% ] 3.69% | 69,574 | 10.3% |
[ 3.5% - 4.0% ] 3.88% | 164,477 | 6.4% |
[ 4.0% - 4.5% ] 4.06% | 121,587 | 6.1% |
[ 4.0% - 4.5% ] 4.25% | 51,979 | 3.2% |
[ 4.0% - 4.5% ] 4.36% | 150,561 | 8.3% |
[ 4.5% - 5.0% ] 4.54% | 381,917 | 8.5% |
[ 4.5% - 5.0% ] 4.69% | 81,449 | 5.0% |
[ 4.5% - 5.0% ] 4.84% | 52,719 | 3.5% |
[ 5.0% - 5.5% ] 5.08% | 34,057 | 9.6% |
[ 5.0% - 5.5% ] 5.18% | 80,975 | 10.2% |
[ 5.0% - 5.5% ] 5.37% | 39,581 | 5.4% |
[ 5.0% - 5.5% ] 5.48% | 292 | 7.3% |
[ 5.5% - 6.0% ] 5.66% | 70,014 | 10.1% |
[ 5.5% - 6.0% ] 5.85% | 49,851 | 14.5% |
[ 6.0% - 6.5% ] 6.02% | 82,658 | 8.8% |
[ 6.0% - 6.5% ] 6.09% | 59,115 | 5.1% |
[ 6.0% - 6.5% ] 6.32% | 90,444 | 9.5% |
[ 6.0% - 6.5% ] 6.48% | 443,665 | 11.6% |
[ 6.5% - 7.0% ] 6.69% | 81,226 | 11.1% |
[ 6.5% - 7.0% ] 6.88% | 1,018 | 3.6% |
[ 7.0% - 7.5% ] 7.00% | 14,727 | 12.3% |
[ 7.0% - 7.5% ] 7.32% | 18,719 | 4.0% |
[ 7.0% - 7.5% ] 7.42% | 58,131 | 11.3% |
[ 7.5% - 8.0% ] 7.65% | 34,500 | 4.2% |
[ 8.0% - 8.5% ] 8.01% | 100,985 | 8.8% |
[ 8.0% - 8.5% ] 8.10% | 1,185 | 8.1% |
[ 8.0% - 8.5% ] 8.27% | 73,842 | 5.7% |
[ 8.5% - 9.0% ] 8.58% | 46,911 | 18.1% |
[ 8.5% - 9.0% ] 8.74% | 14,698 | 13.3% |
[ 9.0% - 9.5% ] 9.19% | 59,121 | 19.2% |
[ 9.0% - 9.5% ] 9.33% | 34,335 | 4.6% |
[ 10.0% - 10.5% ] 10.36% | 2,549 | 1.7% |
[ 10.5% - 11.0% ] 10.62% | 1,083 | 2.9% |
[ 11.0% - 11.5% ] 11.07% | 867 | 2.9% |
[ 11.5% - 12.0% ] 11.53% | 34,742 | 15.2% |
[ 11.5% - 12.0% ] 11.93% | 41,056 | 8.4% |
[ 12.0% - 12.5% ] 12.03% | 582 | 20.2% |
[ 12.5% - 13.0% ] 12.54% | 54,873 | 18.5% |
[ 12.5% - 13.0% ] 12.92% | 12,069 | 15.6% |
[ 13.0% - 13.5% ] 13.02% | 630 | 8.8% |
[ 13.5% - 14.0% ] 13.65% | 740 | 2.8% |
[ 20.5% - 21.0% ] 20.70% | 19,399 | 9.2% |