Nicaraguan 4 or more Vehicles in Household
COMPARE
Nicaraguan
Select to Compare
4 or more Vehicles in Household
Nicaraguan 4 or more Vehicles in Household
7.0%
4+ VEHICLES AVAILABLE
98.0/ 100
METRIC RATING
107th/ 347
METRIC RANK
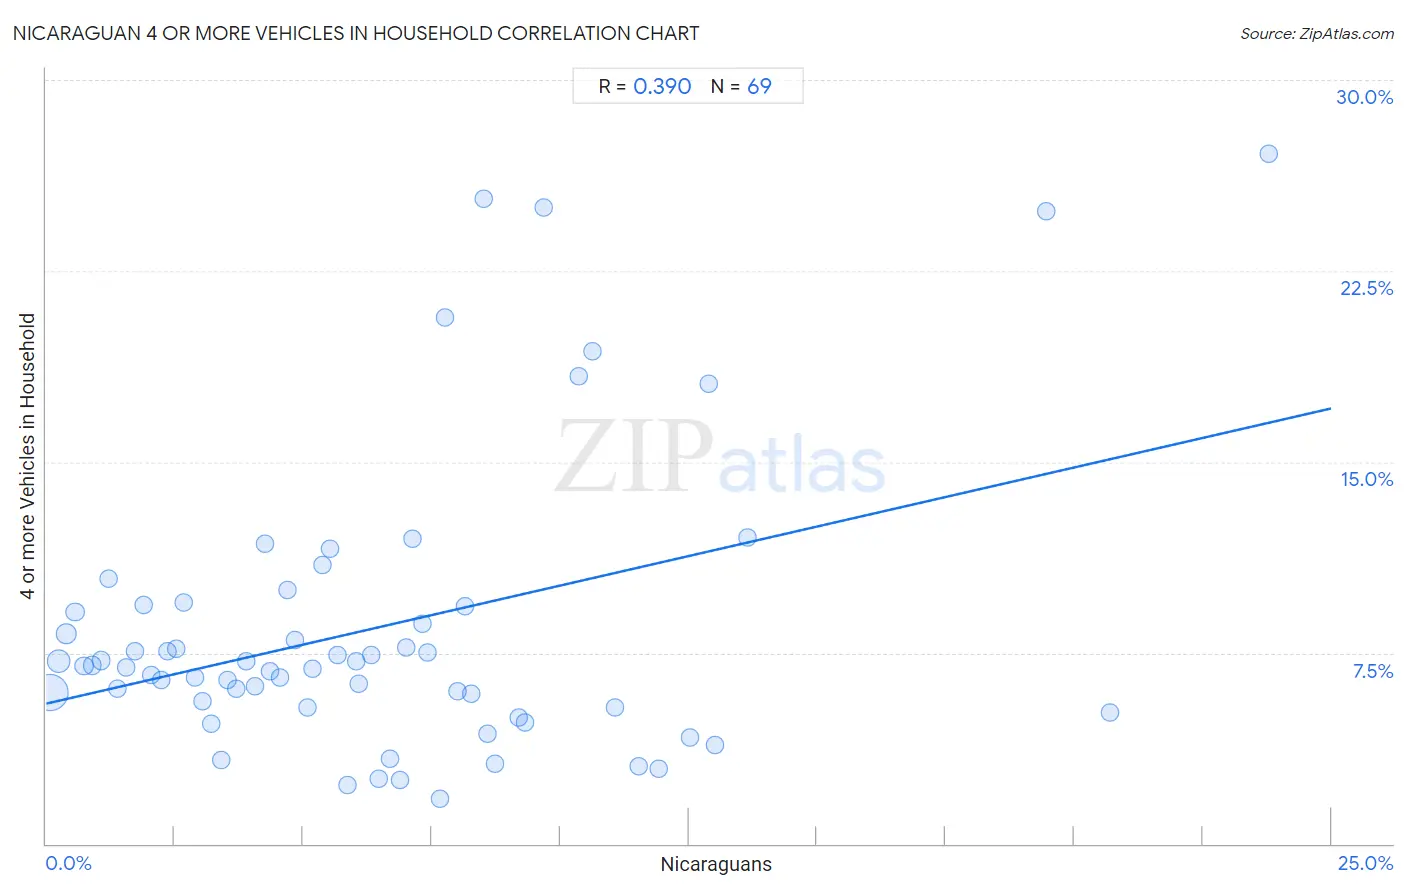
Nicaraguan 4 or more Vehicles in Household Correlation Chart
The statistical analysis conducted on geographies consisting of 284,526,626 people shows a mild positive correlation between the proportion of Nicaraguans and percentage of households with 4 or more vehicles available in the United States with a correlation coefficient (R) of 0.390 and weighted average of 7.0%. On average, for every 1% (one percent) increase in Nicaraguans within a typical geography, there is an increase of 0.46% in percentage of households with 4 or more vehicles available.
It is essential to understand that the correlation between the percentage of Nicaraguans and percentage of households with 4 or more vehicles available does not imply a direct cause-and-effect relationship. It remains uncertain whether the presence of Nicaraguans influences an upward or downward trend in the level of percentage of households with 4 or more vehicles available within an area, or if Nicaraguans simply ended up residing in those areas with higher or lower levels of percentage of households with 4 or more vehicles available due to other factors.
Demographics Similar to Nicaraguans by 4 or more Vehicles in Household
In terms of 4 or more vehicles in household, the demographic groups most similar to Nicaraguans are Guatemalan (7.0%, a difference of 0.010%), French (6.9%, a difference of 0.34%), Hmong (7.0%, a difference of 0.36%), German Russian (7.0%, a difference of 0.36%), and Filipino (6.9%, a difference of 0.52%).
| Demographics | Rating | Rank | 4 or more Vehicles in Household |
| Taiwanese | 98.7 /100 | #100 | Exceptional 7.0% |
| Pakistanis | 98.7 /100 | #101 | Exceptional 7.0% |
| Asians | 98.6 /100 | #102 | Exceptional 7.0% |
| Blackfeet | 98.6 /100 | #103 | Exceptional 7.0% |
| Hmong | 98.3 /100 | #104 | Exceptional 7.0% |
| German Russians | 98.3 /100 | #105 | Exceptional 7.0% |
| Guatemalans | 98.1 /100 | #106 | Exceptional 7.0% |
| Nicaraguans | 98.0 /100 | #107 | Exceptional 7.0% |
| French | 97.7 /100 | #108 | Exceptional 6.9% |
| Filipinos | 97.6 /100 | #109 | Exceptional 6.9% |
| Immigrants from Thailand | 97.0 /100 | #110 | Exceptional 6.9% |
| Aleuts | 97.0 /100 | #111 | Exceptional 6.9% |
| Hopi | 97.0 /100 | #112 | Exceptional 6.9% |
| Canadians | 96.4 /100 | #113 | Exceptional 6.9% |
| Bolivians | 96.3 /100 | #114 | Exceptional 6.8% |
Nicaraguan 4 or more Vehicles in Household Correlation Summary
| Measurement | Nicaraguan Data | 4 or more Vehicles in Household Data |
| Minimum | 0.071% | 1.8% |
| Maximum | 23.8% | 27.1% |
| Range | 23.7% | 25.3% |
| Mean | 6.4% | 8.5% |
| Median | 5.7% | 7.0% |
| Interquartile 25% (IQ1) | 2.8% | 5.3% |
| Interquartile 75% (IQ3) | 8.5% | 9.4% |
| Interquartile Range (IQR) | 5.8% | 4.0% |
| Standard Deviation (Sample) | 4.8% | 5.7% |
| Standard Deviation (Population) | 4.7% | 5.7% |
Correlation Details
| Nicaraguan Percentile | Sample Size | 4 or more Vehicles in Household |
[ 0.0% - 0.5% ] 0.071% | 178,016,625 | 5.9% |
[ 0.0% - 0.5% ] 0.24% | 48,979,526 | 7.2% |
[ 0.0% - 0.5% ] 0.40% | 23,649,313 | 8.3% |
[ 0.5% - 1.0% ] 0.56% | 9,699,360 | 9.1% |
[ 0.5% - 1.0% ] 0.73% | 5,897,185 | 7.0% |
[ 0.5% - 1.0% ] 0.90% | 4,650,118 | 7.0% |
[ 1.0% - 1.5% ] 1.07% | 2,160,673 | 7.2% |
[ 1.0% - 1.5% ] 1.22% | 2,066,927 | 10.4% |
[ 1.0% - 1.5% ] 1.39% | 1,562,773 | 6.1% |
[ 1.5% - 2.0% ] 1.56% | 986,298 | 6.9% |
[ 1.5% - 2.0% ] 1.74% | 474,190 | 7.5% |
[ 1.5% - 2.0% ] 1.89% | 914,193 | 9.4% |
[ 2.0% - 2.5% ] 2.04% | 427,526 | 6.6% |
[ 2.0% - 2.5% ] 2.24% | 500,205 | 6.4% |
[ 2.0% - 2.5% ] 2.36% | 411,420 | 7.5% |
[ 2.5% - 3.0% ] 2.53% | 405,182 | 7.7% |
[ 2.5% - 3.0% ] 2.67% | 195,945 | 9.5% |
[ 2.5% - 3.0% ] 2.88% | 130,164 | 6.6% |
[ 3.0% - 3.5% ] 3.05% | 55,477 | 5.6% |
[ 3.0% - 3.5% ] 3.20% | 217,461 | 4.7% |
[ 3.0% - 3.5% ] 3.41% | 112,426 | 3.3% |
[ 3.5% - 4.0% ] 3.53% | 268,343 | 6.4% |
[ 3.5% - 4.0% ] 3.69% | 72,794 | 6.1% |
[ 3.5% - 4.0% ] 3.88% | 164,477 | 7.2% |
[ 4.0% - 4.5% ] 4.06% | 121,587 | 6.2% |
[ 4.0% - 4.5% ] 4.25% | 57,397 | 11.8% |
[ 4.0% - 4.5% ] 4.36% | 150,561 | 6.8% |
[ 4.5% - 5.0% ] 4.54% | 381,917 | 6.5% |
[ 4.5% - 5.0% ] 4.69% | 81,449 | 10.0% |
[ 4.5% - 5.0% ] 4.84% | 52,719 | 8.0% |
[ 5.0% - 5.5% ] 5.08% | 34,628 | 5.4% |
[ 5.0% - 5.5% ] 5.18% | 80,975 | 6.9% |
[ 5.0% - 5.5% ] 5.37% | 39,581 | 11.0% |
[ 5.5% - 6.0% ] 5.52% | 1,287 | 11.6% |
[ 5.5% - 6.0% ] 5.66% | 73,148 | 7.4% |
[ 5.5% - 6.0% ] 5.85% | 49,851 | 2.3% |
[ 6.0% - 6.5% ] 6.02% | 82,658 | 7.1% |
[ 6.0% - 6.5% ] 6.09% | 59,115 | 6.3% |
[ 6.0% - 6.5% ] 6.32% | 94,134 | 7.4% |
[ 6.0% - 6.5% ] 6.48% | 443,665 | 2.6% |
[ 6.5% - 7.0% ] 6.69% | 81,226 | 3.3% |
[ 6.5% - 7.0% ] 6.88% | 1,018 | 2.5% |
[ 7.0% - 7.5% ] 7.00% | 14,957 | 7.7% |
[ 7.0% - 7.5% ] 7.12% | 1,194 | 12.0% |
[ 7.0% - 7.5% ] 7.32% | 18,719 | 8.6% |
[ 7.0% - 7.5% ] 7.42% | 58,131 | 7.5% |
[ 7.5% - 8.0% ] 7.65% | 34,500 | 1.8% |
[ 7.5% - 8.0% ] 7.75% | 284 | 20.7% |
[ 8.0% - 8.5% ] 8.01% | 102,282 | 6.0% |
[ 8.0% - 8.5% ] 8.15% | 2,379 | 9.3% |
[ 8.0% - 8.5% ] 8.27% | 73,842 | 5.9% |
[ 8.5% - 9.0% ] 8.52% | 270 | 25.3% |
[ 8.5% - 9.0% ] 8.58% | 46,911 | 4.3% |
[ 8.5% - 9.0% ] 8.74% | 14,698 | 3.1% |
[ 9.0% - 9.5% ] 9.19% | 59,121 | 5.0% |
[ 9.0% - 9.5% ] 9.33% | 34,335 | 4.8% |
[ 9.5% - 10.0% ] 9.68% | 62 | 25.0% |
[ 10.0% - 10.5% ] 10.36% | 2,549 | 18.3% |
[ 10.5% - 11.0% ] 10.62% | 1,083 | 19.3% |
[ 11.0% - 11.5% ] 11.07% | 867 | 5.3% |
[ 11.5% - 12.0% ] 11.53% | 34,742 | 3.0% |
[ 11.5% - 12.0% ] 11.93% | 41,056 | 2.9% |
[ 12.5% - 13.0% ] 12.54% | 54,873 | 4.2% |
[ 12.5% - 13.0% ] 12.89% | 3,080 | 18.0% |
[ 13.0% - 13.5% ] 13.02% | 630 | 3.9% |
[ 13.5% - 14.0% ] 13.65% | 740 | 12.0% |
[ 19.0% - 19.5% ] 19.47% | 262 | 24.8% |
[ 20.5% - 21.0% ] 20.70% | 19,399 | 5.2% |
[ 23.5% - 24.0% ] 23.78% | 143 | 27.1% |