Nicaraguan College, 1 year or more
COMPARE
Nicaraguan
Select to Compare
College, 1 year or more
Nicaraguan College, 1 year or more
53.9%
COLLEGE, 1 YEAR OR MORE
0.1/ 100
METRIC RATING
283rd/ 347
METRIC RANK
Nicaraguan College, 1 year or more Correlation Chart
The statistical analysis conducted on geographies consisting of 285,711,182 people shows a weak negative correlation between the proportion of Nicaraguans and percentage of population with at least college, 1 year or more education in the United States with a correlation coefficient (R) of -0.290 and weighted average of 53.9%. On average, for every 1% (one percent) increase in Nicaraguans within a typical geography, there is a decrease of 0.50% in percentage of population with at least college, 1 year or more education.
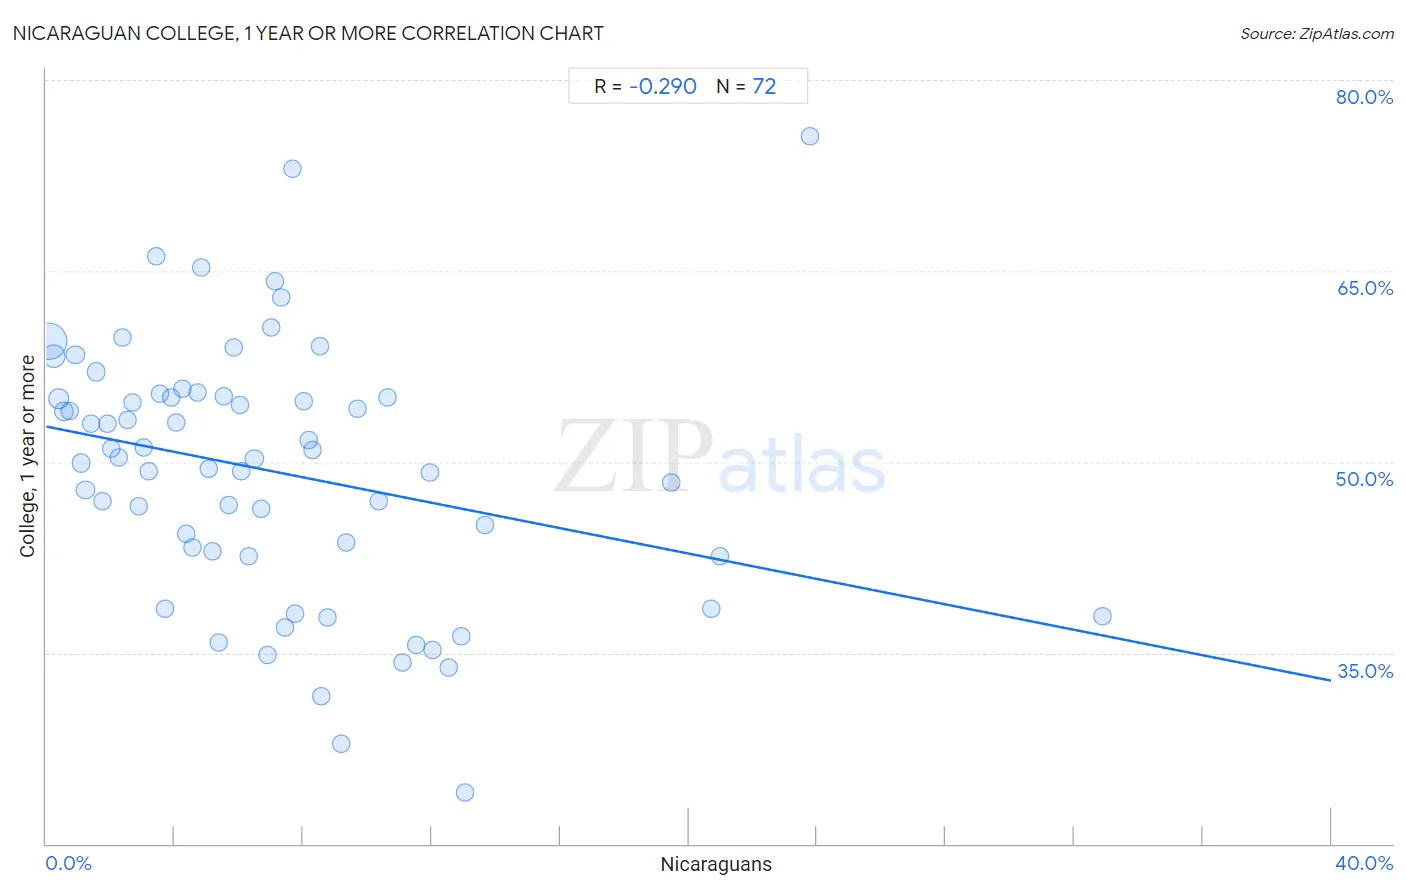
It is essential to understand that the correlation between the percentage of Nicaraguans and percentage of population with at least college, 1 year or more education does not imply a direct cause-and-effect relationship. It remains uncertain whether the presence of Nicaraguans influences an upward or downward trend in the level of percentage of population with at least college, 1 year or more education within an area, or if Nicaraguans simply ended up residing in those areas with higher or lower levels of percentage of population with at least college, 1 year or more education due to other factors.
Demographics Similar to Nicaraguans by College, 1 year or more
In terms of college, 1 year or more, the demographic groups most similar to Nicaraguans are Ute (53.8%, a difference of 0.17%), Guyanese (54.1%, a difference of 0.36%), Colville (54.1%, a difference of 0.40%), Cheyenne (54.1%, a difference of 0.42%), and Arapaho (54.1%, a difference of 0.47%).
| Demographics | Rating | Rank | College, 1 year or more |
| Shoshone | 0.2 /100 | #276 | Tragic 54.3% |
| Ecuadorians | 0.2 /100 | #277 | Tragic 54.3% |
| Immigrants from Jamaica | 0.1 /100 | #278 | Tragic 54.2% |
| Arapaho | 0.1 /100 | #279 | Tragic 54.1% |
| Cheyenne | 0.1 /100 | #280 | Tragic 54.1% |
| Colville | 0.1 /100 | #281 | Tragic 54.1% |
| Guyanese | 0.1 /100 | #282 | Tragic 54.1% |
| Nicaraguans | 0.1 /100 | #283 | Tragic 53.9% |
| Ute | 0.1 /100 | #284 | Tragic 53.8% |
| Immigrants from Guyana | 0.1 /100 | #285 | Tragic 53.5% |
| Central American Indians | 0.1 /100 | #286 | Tragic 53.5% |
| Immigrants from Belize | 0.1 /100 | #287 | Tragic 53.5% |
| Alaska Natives | 0.0 /100 | #288 | Tragic 53.4% |
| Immigrants from Ecuador | 0.0 /100 | #289 | Tragic 53.4% |
| Alaskan Athabascans | 0.0 /100 | #290 | Tragic 53.4% |
Nicaraguan College, 1 year or more Correlation Summary
| Measurement | Nicaraguan Data | College, 1 year or more Data |
| Minimum | 0.071% | 24.0% |
| Maximum | 32.9% | 75.6% |
| Range | 32.8% | 51.6% |
| Mean | 7.0% | 49.3% |
| Median | 5.9% | 50.3% |
| Interquartile 25% (IQ1) | 3.0% | 42.8% |
| Interquartile 75% (IQ3) | 9.0% | 55.1% |
| Interquartile Range (IQR) | 6.0% | 12.3% |
| Standard Deviation (Sample) | 5.9% | 10.1% |
| Standard Deviation (Population) | 5.9% | 10.1% |
Correlation Details
| Nicaraguan Percentile | Sample Size | College, 1 year or more |
[ 0.0% - 0.5% ] 0.071% | 178,754,693 | 59.5% |
[ 0.0% - 0.5% ] 0.24% | 49,107,345 | 58.3% |
[ 0.0% - 0.5% ] 0.40% | 23,754,500 | 54.9% |
[ 0.5% - 1.0% ] 0.56% | 9,798,453 | 54.0% |
[ 0.5% - 1.0% ] 0.73% | 5,908,354 | 54.0% |
[ 0.5% - 1.0% ] 0.90% | 4,651,071 | 58.4% |
[ 1.0% - 1.5% ] 1.07% | 2,205,053 | 49.9% |
[ 1.0% - 1.5% ] 1.22% | 2,076,820 | 47.8% |
[ 1.0% - 1.5% ] 1.39% | 1,566,125 | 53.0% |
[ 1.5% - 2.0% ] 1.56% | 1,007,813 | 57.1% |
[ 1.5% - 2.0% ] 1.74% | 475,924 | 46.9% |
[ 1.5% - 2.0% ] 1.89% | 915,272 | 53.0% |
[ 2.0% - 2.5% ] 2.04% | 427,526 | 51.0% |
[ 2.0% - 2.5% ] 2.24% | 500,382 | 50.4% |
[ 2.0% - 2.5% ] 2.36% | 411,420 | 59.8% |
[ 2.5% - 3.0% ] 2.53% | 411,448 | 53.3% |
[ 2.5% - 3.0% ] 2.67% | 195,945 | 54.7% |
[ 2.5% - 3.0% ] 2.88% | 130,164 | 46.6% |
[ 3.0% - 3.5% ] 3.04% | 56,882 | 51.1% |
[ 3.0% - 3.5% ] 3.20% | 217,683 | 49.3% |
[ 3.0% - 3.5% ] 3.41% | 112,426 | 66.1% |
[ 3.5% - 4.0% ] 3.53% | 268,454 | 55.4% |
[ 3.5% - 4.0% ] 3.69% | 72,794 | 38.5% |
[ 3.5% - 4.0% ] 3.88% | 164,477 | 55.1% |
[ 4.0% - 4.5% ] 4.06% | 121,587 | 53.1% |
[ 4.0% - 4.5% ] 4.25% | 57,397 | 55.7% |
[ 4.0% - 4.5% ] 4.36% | 150,561 | 44.3% |
[ 4.5% - 5.0% ] 4.54% | 381,917 | 43.2% |
[ 4.5% - 5.0% ] 4.69% | 81,449 | 55.4% |
[ 4.5% - 5.0% ] 4.84% | 52,719 | 65.2% |
[ 5.0% - 5.5% ] 5.08% | 34,628 | 49.5% |
[ 5.0% - 5.5% ] 5.18% | 80,975 | 43.0% |
[ 5.0% - 5.5% ] 5.37% | 39,581 | 35.9% |
[ 5.5% - 6.0% ] 5.52% | 1,287 | 55.2% |
[ 5.5% - 6.0% ] 5.66% | 73,148 | 46.6% |
[ 5.5% - 6.0% ] 5.85% | 49,851 | 59.0% |
[ 6.0% - 6.5% ] 6.02% | 82,658 | 54.5% |
[ 6.0% - 6.5% ] 6.09% | 59,115 | 49.3% |
[ 6.0% - 6.5% ] 6.32% | 94,134 | 42.6% |
[ 6.0% - 6.5% ] 6.48% | 443,665 | 50.3% |
[ 6.5% - 7.0% ] 6.69% | 81,226 | 46.3% |
[ 6.5% - 7.0% ] 6.88% | 1,018 | 34.8% |
[ 7.0% - 7.5% ] 7.00% | 14,957 | 60.5% |
[ 7.0% - 7.5% ] 7.12% | 1,194 | 64.2% |
[ 7.0% - 7.5% ] 7.32% | 18,719 | 62.9% |
[ 7.0% - 7.5% ] 7.42% | 58,131 | 37.0% |
[ 7.5% - 8.0% ] 7.65% | 35,034 | 73.1% |
[ 7.5% - 8.0% ] 7.75% | 284 | 38.1% |
[ 8.0% - 8.5% ] 8.01% | 102,282 | 54.7% |
[ 8.0% - 8.5% ] 8.15% | 2,379 | 51.7% |
[ 8.0% - 8.5% ] 8.27% | 73,842 | 50.9% |
[ 8.5% - 9.0% ] 8.52% | 270 | 59.1% |
[ 8.5% - 9.0% ] 8.58% | 46,911 | 31.5% |
[ 8.5% - 9.0% ] 8.74% | 14,698 | 37.8% |
[ 9.0% - 9.5% ] 9.19% | 59,121 | 27.9% |
[ 9.0% - 9.5% ] 9.33% | 34,335 | 43.7% |
[ 9.5% - 10.0% ] 9.68% | 62 | 54.2% |
[ 10.0% - 10.5% ] 10.36% | 2,549 | 46.9% |
[ 10.5% - 11.0% ] 10.62% | 1,083 | 55.1% |
[ 11.0% - 11.5% ] 11.07% | 867 | 34.3% |
[ 11.5% - 12.0% ] 11.53% | 34,742 | 35.6% |
[ 11.5% - 12.0% ] 11.93% | 41,056 | 49.2% |
[ 12.0% - 12.5% ] 12.03% | 582 | 35.2% |
[ 12.5% - 13.0% ] 12.54% | 54,873 | 33.9% |
[ 12.5% - 13.0% ] 12.92% | 12,069 | 36.3% |
[ 13.0% - 13.5% ] 13.02% | 630 | 24.0% |
[ 13.5% - 14.0% ] 13.65% | 740 | 45.0% |
[ 19.0% - 19.5% ] 19.47% | 262 | 48.4% |
[ 20.5% - 21.0% ] 20.70% | 19,399 | 38.5% |
[ 20.5% - 21.0% ] 20.96% | 334 | 42.6% |
[ 23.5% - 24.0% ] 23.78% | 143 | 75.6% |
[ 32.5% - 33.0% ] 32.88% | 1,694 | 37.9% |