Nicaraguan 2 or more Vehicles in Household
COMPARE
Nicaraguan
Select to Compare
2 or more Vehicles in Household
Nicaraguan 2 or more Vehicles in Household
56.1%
2+ VEHICLES AVAILABLE
79.9/ 100
METRIC RATING
150th/ 347
METRIC RANK
Nicaraguan 2 or more Vehicles in Household Correlation Chart
The statistical analysis conducted on geographies consisting of 285,625,326 people shows no correlation between the proportion of Nicaraguans and percentage of households with 2 or more vehicles available in the United States with a correlation coefficient (R) of 0.048 and weighted average of 56.1%. On average, for every 1% (one percent) increase in Nicaraguans within a typical geography, there is an increase of 0.12% in percentage of households with 2 or more vehicles available.
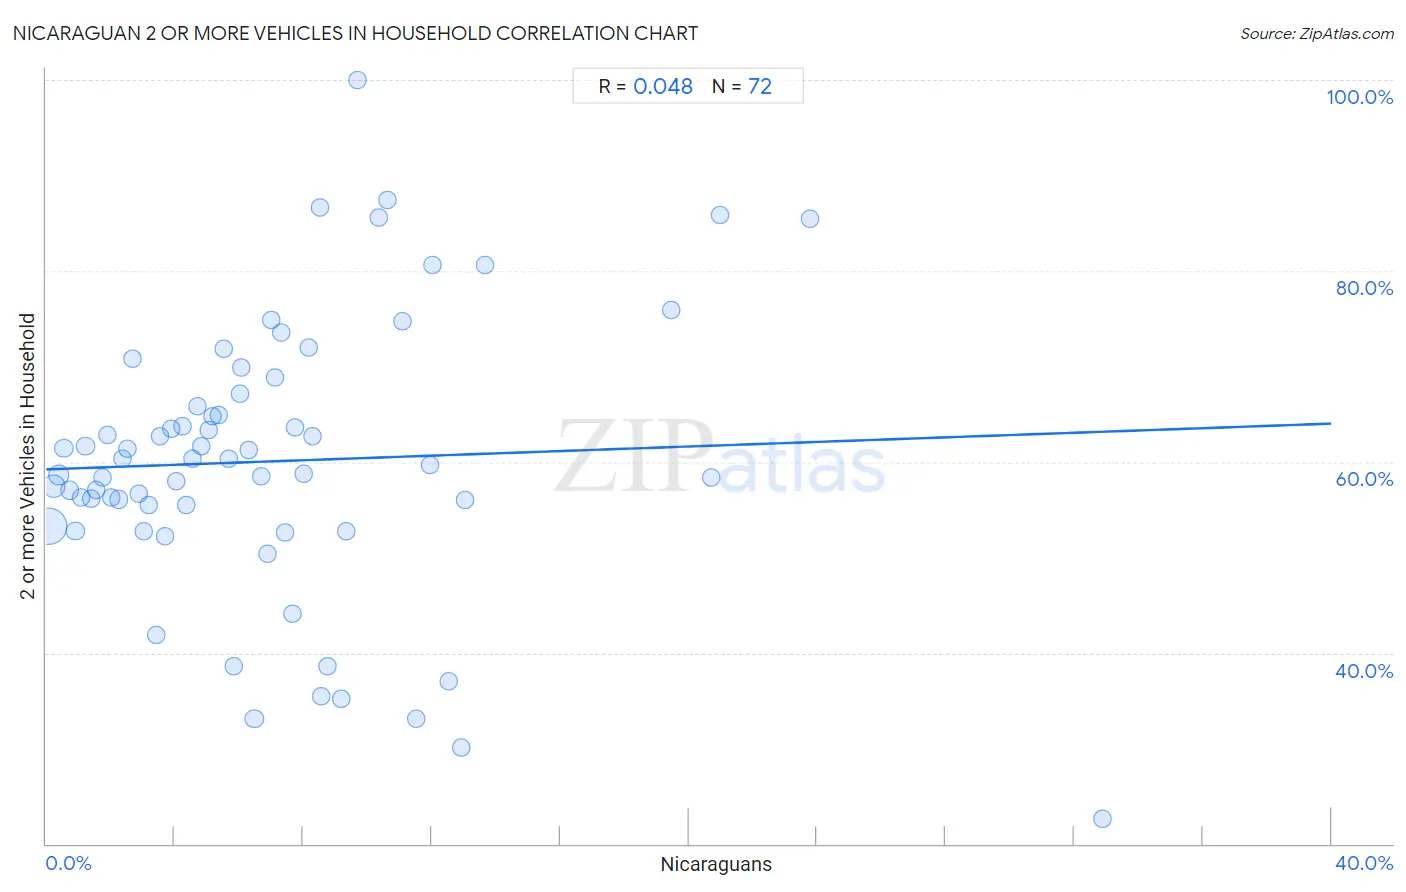
It is essential to understand that the correlation between the percentage of Nicaraguans and percentage of households with 2 or more vehicles available does not imply a direct cause-and-effect relationship. It remains uncertain whether the presence of Nicaraguans influences an upward or downward trend in the level of percentage of households with 2 or more vehicles available within an area, or if Nicaraguans simply ended up residing in those areas with higher or lower levels of percentage of households with 2 or more vehicles available due to other factors.
Demographics Similar to Nicaraguans by 2 or more Vehicles in Household
In terms of 2 or more vehicles in household, the demographic groups most similar to Nicaraguans are Immigrants from Moldova (56.1%, a difference of 0.020%), Chilean (56.1%, a difference of 0.020%), Serbian (56.1%, a difference of 0.030%), Venezuelan (56.1%, a difference of 0.050%), and Immigrants from Northern Europe (56.1%, a difference of 0.070%).
| Demographics | Rating | Rank | 2 or more Vehicles in Household |
| Seminole | 81.7 /100 | #143 | Excellent 56.2% |
| Immigrants from Syria | 81.4 /100 | #144 | Excellent 56.2% |
| Syrians | 81.2 /100 | #145 | Excellent 56.2% |
| Venezuelans | 80.7 /100 | #146 | Excellent 56.1% |
| Serbians | 80.3 /100 | #147 | Excellent 56.1% |
| Immigrants from Moldova | 80.2 /100 | #148 | Excellent 56.1% |
| Chileans | 80.2 /100 | #149 | Excellent 56.1% |
| Nicaraguans | 79.9 /100 | #150 | Good 56.1% |
| Immigrants from Northern Europe | 78.7 /100 | #151 | Good 56.1% |
| Immigrants from Pakistan | 78.1 /100 | #152 | Good 56.1% |
| Lumbee | 71.9 /100 | #153 | Good 55.9% |
| Ukrainians | 70.8 /100 | #154 | Good 55.8% |
| Immigrants from Venezuela | 70.7 /100 | #155 | Good 55.8% |
| Immigrants from Lithuania | 70.4 /100 | #156 | Good 55.8% |
| Immigrants from Kuwait | 70.2 /100 | #157 | Good 55.8% |
Nicaraguan 2 or more Vehicles in Household Correlation Summary
| Measurement | Nicaraguan Data | 2 or more Vehicles in Household Data |
| Minimum | 0.071% | 22.6% |
| Maximum | 32.9% | 100.0% |
| Range | 32.8% | 77.4% |
| Mean | 7.0% | 60.1% |
| Median | 5.9% | 60.0% |
| Interquartile 25% (IQ1) | 3.0% | 54.4% |
| Interquartile 75% (IQ3) | 9.0% | 66.5% |
| Interquartile Range (IQR) | 6.0% | 12.1% |
| Standard Deviation (Sample) | 5.9% | 14.6% |
| Standard Deviation (Population) | 5.9% | 14.5% |
Correlation Details
| Nicaraguan Percentile | Sample Size | 2 or more Vehicles in Household |
[ 0.0% - 0.5% ] 0.071% | 178,729,806 | 53.2% |
[ 0.0% - 0.5% ] 0.24% | 49,072,756 | 57.5% |
[ 0.0% - 0.5% ] 0.40% | 23,749,741 | 58.7% |
[ 0.5% - 1.0% ] 0.56% | 9,785,144 | 61.4% |
[ 0.5% - 1.0% ] 0.73% | 5,905,602 | 57.0% |
[ 0.5% - 1.0% ] 0.90% | 4,651,071 | 52.8% |
[ 1.0% - 1.5% ] 1.07% | 2,205,053 | 56.3% |
[ 1.0% - 1.5% ] 1.22% | 2,074,433 | 61.6% |
[ 1.0% - 1.5% ] 1.39% | 1,565,768 | 56.1% |
[ 1.5% - 2.0% ] 1.56% | 1,007,749 | 57.1% |
[ 1.5% - 2.0% ] 1.74% | 474,428 | 58.4% |
[ 1.5% - 2.0% ] 1.89% | 914,193 | 62.8% |
[ 2.0% - 2.5% ] 2.04% | 427,526 | 56.3% |
[ 2.0% - 2.5% ] 2.24% | 500,205 | 56.1% |
[ 2.0% - 2.5% ] 2.36% | 411,420 | 60.3% |
[ 2.5% - 3.0% ] 2.53% | 411,448 | 61.3% |
[ 2.5% - 3.0% ] 2.67% | 195,945 | 70.8% |
[ 2.5% - 3.0% ] 2.88% | 130,164 | 56.7% |
[ 3.0% - 3.5% ] 3.04% | 56,882 | 52.8% |
[ 3.0% - 3.5% ] 3.20% | 217,683 | 55.5% |
[ 3.0% - 3.5% ] 3.41% | 112,426 | 41.8% |
[ 3.5% - 4.0% ] 3.53% | 268,454 | 62.7% |
[ 3.5% - 4.0% ] 3.69% | 72,794 | 52.3% |
[ 3.5% - 4.0% ] 3.88% | 164,477 | 63.5% |
[ 4.0% - 4.5% ] 4.06% | 121,587 | 58.0% |
[ 4.0% - 4.5% ] 4.25% | 57,397 | 63.7% |
[ 4.0% - 4.5% ] 4.36% | 150,561 | 55.5% |
[ 4.5% - 5.0% ] 4.54% | 381,917 | 60.4% |
[ 4.5% - 5.0% ] 4.69% | 81,449 | 65.8% |
[ 4.5% - 5.0% ] 4.84% | 52,719 | 61.6% |
[ 5.0% - 5.5% ] 5.08% | 34,628 | 63.3% |
[ 5.0% - 5.5% ] 5.18% | 80,975 | 64.8% |
[ 5.0% - 5.5% ] 5.37% | 39,581 | 64.9% |
[ 5.5% - 6.0% ] 5.52% | 1,287 | 71.9% |
[ 5.5% - 6.0% ] 5.66% | 73,148 | 60.4% |
[ 5.5% - 6.0% ] 5.85% | 49,851 | 38.6% |
[ 6.0% - 6.5% ] 6.02% | 82,658 | 67.1% |
[ 6.0% - 6.5% ] 6.09% | 59,115 | 69.9% |
[ 6.0% - 6.5% ] 6.32% | 94,134 | 61.2% |
[ 6.0% - 6.5% ] 6.48% | 443,665 | 33.1% |
[ 6.5% - 7.0% ] 6.69% | 81,226 | 58.5% |
[ 6.5% - 7.0% ] 6.88% | 1,018 | 50.3% |
[ 7.0% - 7.5% ] 7.00% | 14,957 | 74.9% |
[ 7.0% - 7.5% ] 7.12% | 1,194 | 68.8% |
[ 7.0% - 7.5% ] 7.32% | 18,719 | 73.5% |
[ 7.0% - 7.5% ] 7.42% | 58,131 | 52.6% |
[ 7.5% - 8.0% ] 7.65% | 35,034 | 44.0% |
[ 7.5% - 8.0% ] 7.75% | 284 | 63.6% |
[ 8.0% - 8.5% ] 8.01% | 102,282 | 58.8% |
[ 8.0% - 8.5% ] 8.15% | 2,379 | 72.0% |
[ 8.0% - 8.5% ] 8.27% | 73,842 | 62.7% |
[ 8.5% - 9.0% ] 8.52% | 270 | 86.7% |
[ 8.5% - 9.0% ] 8.58% | 46,911 | 35.4% |
[ 8.5% - 9.0% ] 8.74% | 14,698 | 38.6% |
[ 9.0% - 9.5% ] 9.19% | 59,121 | 35.1% |
[ 9.0% - 9.5% ] 9.33% | 34,335 | 52.7% |
[ 9.5% - 10.0% ] 9.68% | 62 | 100.0% |
[ 10.0% - 10.5% ] 10.36% | 2,549 | 85.6% |
[ 10.5% - 11.0% ] 10.62% | 1,083 | 87.4% |
[ 11.0% - 11.5% ] 11.07% | 867 | 74.7% |
[ 11.5% - 12.0% ] 11.53% | 34,742 | 33.1% |
[ 11.5% - 12.0% ] 11.93% | 41,056 | 59.7% |
[ 12.0% - 12.5% ] 12.03% | 582 | 80.7% |
[ 12.5% - 13.0% ] 12.54% | 54,873 | 37.0% |
[ 12.5% - 13.0% ] 12.92% | 12,069 | 30.0% |
[ 13.0% - 13.5% ] 13.02% | 630 | 56.0% |
[ 13.5% - 14.0% ] 13.65% | 740 | 80.7% |
[ 19.0% - 19.5% ] 19.47% | 262 | 75.9% |
[ 20.5% - 21.0% ] 20.70% | 19,399 | 58.4% |
[ 20.5% - 21.0% ] 20.96% | 334 | 85.9% |
[ 23.5% - 24.0% ] 23.78% | 143 | 85.4% |
[ 32.5% - 33.0% ] 32.88% | 1,694 | 22.6% |