Nicaraguan Disability
COMPARE
Nicaraguan
Select to Compare
Disability
Nicaraguan Disability
11.3%
DISABILITY
96.2/ 100
METRIC RATING
107th/ 347
METRIC RANK
Nicaraguan Disability Correlation Chart
The statistical analysis conducted on geographies consisting of 285,692,565 people shows a slight negative correlation between the proportion of Nicaraguans and percentage of population with a disability in the United States with a correlation coefficient (R) of -0.087 and weighted average of 11.3%. On average, for every 1% (one percent) increase in Nicaraguans within a typical geography, there is a decrease of 0.040% in percentage of population with a disability.
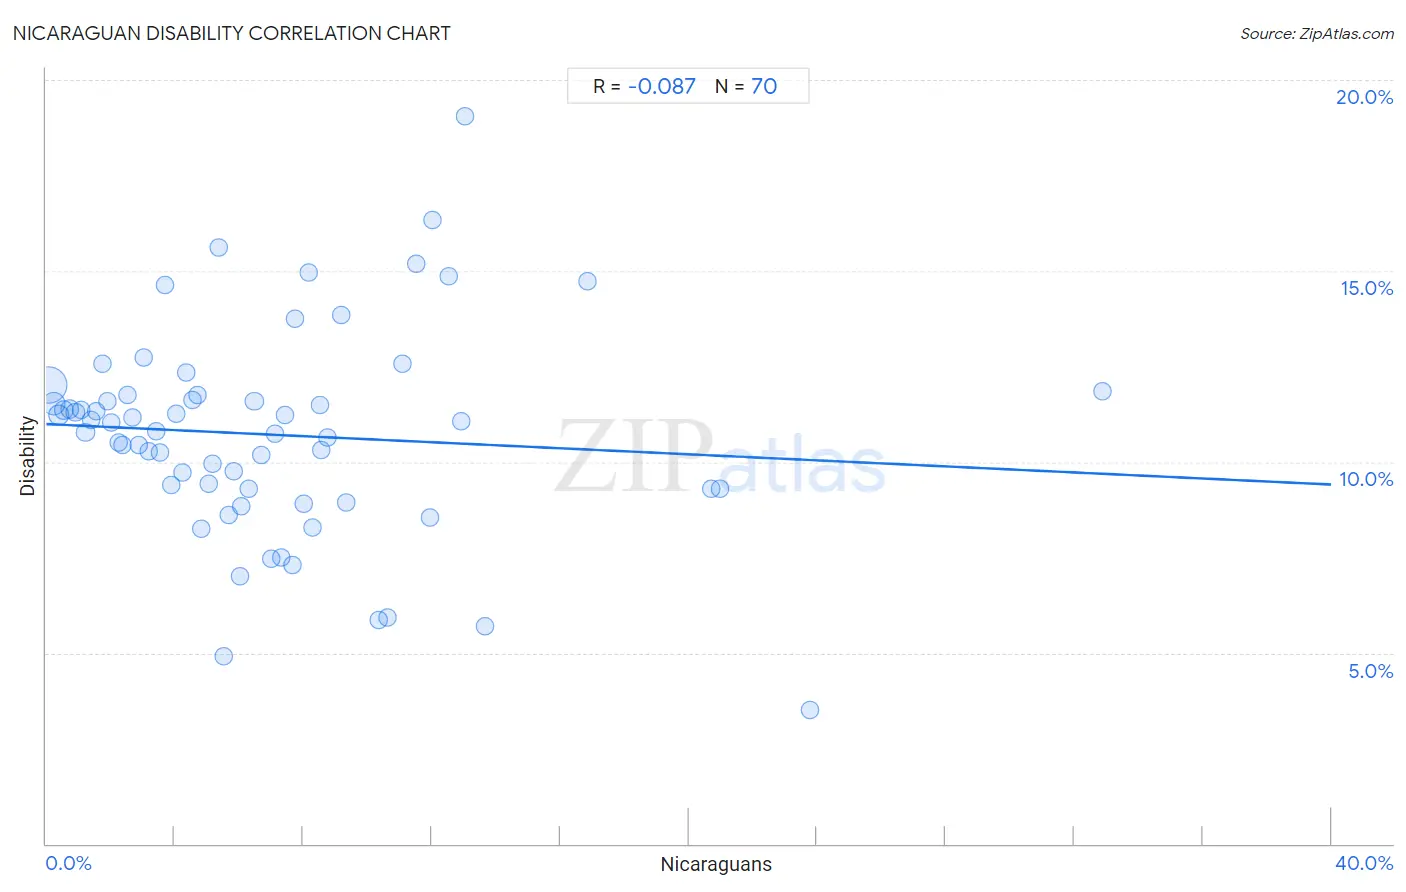
It is essential to understand that the correlation between the percentage of Nicaraguans and percentage of population with a disability does not imply a direct cause-and-effect relationship. It remains uncertain whether the presence of Nicaraguans influences an upward or downward trend in the level of percentage of population with a disability within an area, or if Nicaraguans simply ended up residing in those areas with higher or lower levels of percentage of population with a disability due to other factors.
Demographics Similar to Nicaraguans by Disability
In terms of disability, the demographic groups most similar to Nicaraguans are Immigrants from Eastern Europe (11.3%, a difference of 0.020%), Immigrants from Kazakhstan (11.3%, a difference of 0.050%), Immigrants from Uruguay (11.3%, a difference of 0.060%), Immigrants (11.3%, a difference of 0.060%), and Immigrants from Nigeria (11.3%, a difference of 0.080%).
| Demographics | Rating | Rank | Disability |
| Immigrants from Greece | 96.9 /100 | #100 | Exceptional 11.3% |
| Immigrants from Nicaragua | 96.8 /100 | #101 | Exceptional 11.3% |
| Immigrants from Eastern Africa | 96.7 /100 | #102 | Exceptional 11.3% |
| Immigrants from Uruguay | 96.4 /100 | #103 | Exceptional 11.3% |
| Immigrants | 96.4 /100 | #104 | Exceptional 11.3% |
| Immigrants from Kazakhstan | 96.4 /100 | #105 | Exceptional 11.3% |
| Immigrants from Eastern Europe | 96.3 /100 | #106 | Exceptional 11.3% |
| Nicaraguans | 96.2 /100 | #107 | Exceptional 11.3% |
| Immigrants from Nigeria | 96.0 /100 | #108 | Exceptional 11.3% |
| Immigrants from Uganda | 95.7 /100 | #109 | Exceptional 11.3% |
| Immigrants from Denmark | 95.6 /100 | #110 | Exceptional 11.3% |
| Immigrants from South Eastern Asia | 95.4 /100 | #111 | Exceptional 11.3% |
| Immigrants from Uzbekistan | 94.9 /100 | #112 | Exceptional 11.3% |
| Guyanese | 94.7 /100 | #113 | Exceptional 11.3% |
| Immigrants from Syria | 94.7 /100 | #114 | Exceptional 11.3% |
Nicaraguan Disability Correlation Summary
| Measurement | Nicaraguan Data | Disability Data |
| Minimum | 0.071% | 3.5% |
| Maximum | 32.9% | 19.0% |
| Range | 32.8% | 15.6% |
| Mean | 6.9% | 10.7% |
| Median | 5.8% | 10.9% |
| Interquartile 25% (IQ1) | 2.9% | 9.3% |
| Interquartile 75% (IQ3) | 8.7% | 11.7% |
| Interquartile Range (IQR) | 5.9% | 2.5% |
| Standard Deviation (Sample) | 5.9% | 2.7% |
| Standard Deviation (Population) | 5.9% | 2.7% |
Correlation Details
| Nicaraguan Percentile | Sample Size | Disability |
[ 0.0% - 0.5% ] 0.071% | 178,752,122 | 12.0% |
[ 0.0% - 0.5% ] 0.24% | 49,104,763 | 11.5% |
[ 0.0% - 0.5% ] 0.40% | 23,753,542 | 11.2% |
[ 0.5% - 1.0% ] 0.56% | 9,788,405 | 11.4% |
[ 0.5% - 1.0% ] 0.73% | 5,908,354 | 11.4% |
[ 0.5% - 1.0% ] 0.90% | 4,651,071 | 11.3% |
[ 1.0% - 1.5% ] 1.07% | 2,205,053 | 11.4% |
[ 1.0% - 1.5% ] 1.22% | 2,076,820 | 10.8% |
[ 1.0% - 1.5% ] 1.39% | 1,566,142 | 11.1% |
[ 1.5% - 2.0% ] 1.56% | 1,007,749 | 11.3% |
[ 1.5% - 2.0% ] 1.74% | 474,760 | 12.6% |
[ 1.5% - 2.0% ] 1.89% | 915,272 | 11.6% |
[ 2.0% - 2.5% ] 2.04% | 427,526 | 11.0% |
[ 2.0% - 2.5% ] 2.24% | 500,382 | 10.5% |
[ 2.0% - 2.5% ] 2.36% | 411,420 | 10.4% |
[ 2.5% - 3.0% ] 2.53% | 411,448 | 11.7% |
[ 2.5% - 3.0% ] 2.67% | 195,945 | 11.2% |
[ 2.5% - 3.0% ] 2.88% | 130,164 | 10.4% |
[ 3.0% - 3.5% ] 3.04% | 56,882 | 12.7% |
[ 3.0% - 3.5% ] 3.20% | 217,683 | 10.3% |
[ 3.0% - 3.5% ] 3.41% | 112,426 | 10.8% |
[ 3.5% - 4.0% ] 3.53% | 268,454 | 10.2% |
[ 3.5% - 4.0% ] 3.69% | 72,794 | 14.6% |
[ 3.5% - 4.0% ] 3.88% | 164,477 | 9.4% |
[ 4.0% - 4.5% ] 4.06% | 121,587 | 11.3% |
[ 4.0% - 4.5% ] 4.25% | 57,397 | 9.7% |
[ 4.0% - 4.5% ] 4.36% | 150,561 | 12.3% |
[ 4.5% - 5.0% ] 4.54% | 381,917 | 11.6% |
[ 4.5% - 5.0% ] 4.69% | 81,449 | 11.8% |
[ 4.5% - 5.0% ] 4.84% | 52,719 | 8.3% |
[ 5.0% - 5.5% ] 5.08% | 34,628 | 9.4% |
[ 5.0% - 5.5% ] 5.18% | 80,975 | 10.0% |
[ 5.0% - 5.5% ] 5.37% | 39,581 | 15.6% |
[ 5.5% - 6.0% ] 5.52% | 1,287 | 4.9% |
[ 5.5% - 6.0% ] 5.66% | 73,148 | 8.6% |
[ 5.5% - 6.0% ] 5.85% | 49,851 | 9.8% |
[ 6.0% - 6.5% ] 6.02% | 82,658 | 7.0% |
[ 6.0% - 6.5% ] 6.09% | 59,115 | 8.8% |
[ 6.0% - 6.5% ] 6.32% | 94,134 | 9.3% |
[ 6.0% - 6.5% ] 6.48% | 443,665 | 11.6% |
[ 6.5% - 7.0% ] 6.69% | 81,226 | 10.2% |
[ 7.0% - 7.5% ] 7.00% | 14,957 | 7.5% |
[ 7.0% - 7.5% ] 7.12% | 1,194 | 10.7% |
[ 7.0% - 7.5% ] 7.32% | 18,719 | 7.5% |
[ 7.0% - 7.5% ] 7.42% | 58,131 | 11.2% |
[ 7.5% - 8.0% ] 7.65% | 35,034 | 7.3% |
[ 7.5% - 8.0% ] 7.75% | 284 | 13.7% |
[ 8.0% - 8.5% ] 8.01% | 102,282 | 8.9% |
[ 8.0% - 8.5% ] 8.15% | 2,379 | 15.0% |
[ 8.0% - 8.5% ] 8.27% | 73,842 | 8.3% |
[ 8.5% - 9.0% ] 8.52% | 270 | 11.5% |
[ 8.5% - 9.0% ] 8.58% | 46,911 | 10.3% |
[ 8.5% - 9.0% ] 8.74% | 14,698 | 10.6% |
[ 9.0% - 9.5% ] 9.19% | 59,121 | 13.8% |
[ 9.0% - 9.5% ] 9.33% | 34,335 | 8.9% |
[ 10.0% - 10.5% ] 10.36% | 2,549 | 5.8% |
[ 10.5% - 11.0% ] 10.62% | 1,083 | 5.9% |
[ 11.0% - 11.5% ] 11.07% | 867 | 12.6% |
[ 11.5% - 12.0% ] 11.53% | 34,742 | 15.2% |
[ 11.5% - 12.0% ] 11.93% | 41,056 | 8.6% |
[ 12.0% - 12.5% ] 12.03% | 582 | 16.3% |
[ 12.5% - 13.0% ] 12.54% | 54,873 | 14.9% |
[ 12.5% - 13.0% ] 12.92% | 12,069 | 11.1% |
[ 13.0% - 13.5% ] 13.02% | 630 | 19.0% |
[ 13.5% - 14.0% ] 13.65% | 740 | 5.7% |
[ 16.5% - 17.0% ] 16.84% | 95 | 14.7% |
[ 20.5% - 21.0% ] 20.70% | 19,399 | 9.3% |
[ 20.5% - 21.0% ] 20.96% | 334 | 9.3% |
[ 23.5% - 24.0% ] 23.78% | 143 | 3.5% |
[ 32.5% - 33.0% ] 32.88% | 1,694 | 11.9% |