Maltese Married-couple Households
COMPARE
Maltese
Select to Compare
Married-couple Households
Maltese Married-couple Households
49.2%
MARRIED-COUPLE HOUSEHOLDS
99.8/ 100
METRIC RATING
29th/ 347
METRIC RANK
Maltese Married-couple Households Correlation Chart
The statistical analysis conducted on geographies consisting of 126,420,925 people shows a weak positive correlation between the proportion of Maltese and percentage of married-couple family households in the United States with a correlation coefficient (R) of 0.267 and weighted average of 49.2%. On average, for every 1% (one percent) increase in Maltese within a typical geography, there is an increase of 0.95% in percentage of married-couple family households.
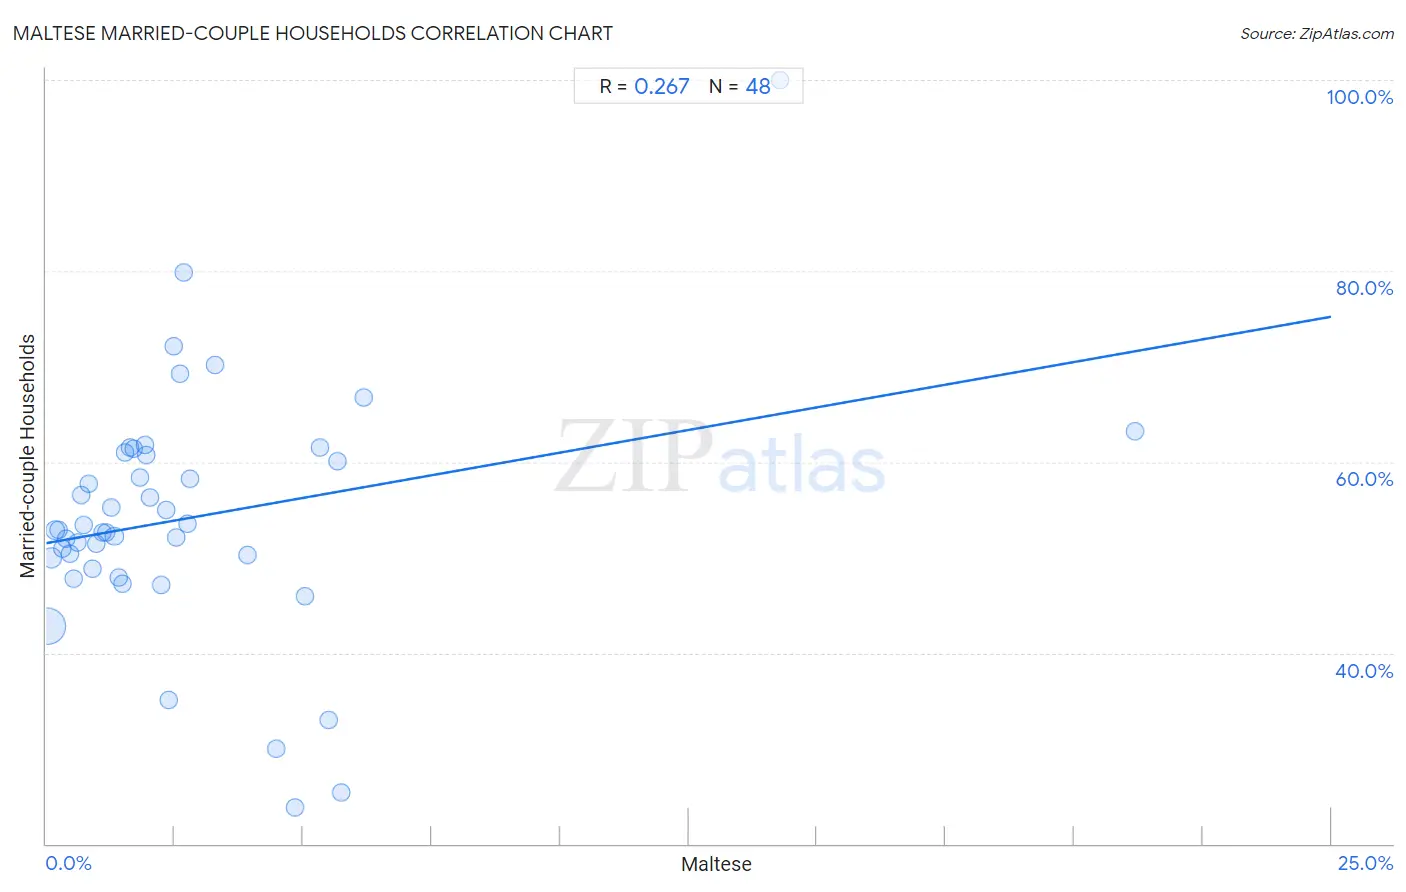
It is essential to understand that the correlation between the percentage of Maltese and percentage of married-couple family households does not imply a direct cause-and-effect relationship. It remains uncertain whether the presence of Maltese influences an upward or downward trend in the level of percentage of married-couple family households within an area, or if Maltese simply ended up residing in those areas with higher or lower levels of percentage of married-couple family households due to other factors.
Demographics Similar to Maltese by Married-couple Households
In terms of married-couple households, the demographic groups most similar to Maltese are German (49.2%, a difference of 0.010%), Bolivian (49.2%, a difference of 0.020%), Native Hawaiian (49.1%, a difference of 0.12%), Hungarian (49.1%, a difference of 0.18%), and Bhutanese (49.3%, a difference of 0.20%).
| Demographics | Rating | Rank | Married-couple Households |
| Asians | 99.9 /100 | #22 | Exceptional 49.5% |
| Dutch | 99.9 /100 | #23 | Exceptional 49.5% |
| Czechs | 99.9 /100 | #24 | Exceptional 49.4% |
| Immigrants from Philippines | 99.9 /100 | #25 | Exceptional 49.3% |
| Immigrants from Scotland | 99.8 /100 | #26 | Exceptional 49.3% |
| Bhutanese | 99.8 /100 | #27 | Exceptional 49.3% |
| Germans | 99.8 /100 | #28 | Exceptional 49.2% |
| Maltese | 99.8 /100 | #29 | Exceptional 49.2% |
| Bolivians | 99.8 /100 | #30 | Exceptional 49.2% |
| Native Hawaiians | 99.8 /100 | #31 | Exceptional 49.1% |
| Hungarians | 99.8 /100 | #32 | Exceptional 49.1% |
| Immigrants from Asia | 99.7 /100 | #33 | Exceptional 49.1% |
| Italians | 99.7 /100 | #34 | Exceptional 49.0% |
| Scottish | 99.7 /100 | #35 | Exceptional 49.0% |
| Iranians | 99.7 /100 | #36 | Exceptional 49.0% |
Maltese Married-couple Households Correlation Summary
| Measurement | Maltese Data | Married-couple Households Data |
| Minimum | 0.020% | 23.8% |
| Maximum | 21.2% | 100.0% |
| Range | 21.2% | 76.2% |
| Mean | 2.8% | 54.2% |
| Median | 1.9% | 52.9% |
| Interquartile 25% (IQ1) | 0.86% | 49.4% |
| Interquartile 75% (IQ3) | 3.0% | 60.8% |
| Interquartile Range (IQR) | 2.2% | 11.5% |
| Standard Deviation (Sample) | 3.6% | 12.9% |
| Standard Deviation (Population) | 3.6% | 12.8% |
Correlation Details
| Maltese Percentile | Sample Size | Married-couple Households |
[ 0.0% - 0.5% ] 0.020% | 104,512,347 | 42.7% |
[ 0.0% - 0.5% ] 0.10% | 10,779,793 | 50.0% |
[ 0.0% - 0.5% ] 0.17% | 4,234,013 | 52.8% |
[ 0.0% - 0.5% ] 0.25% | 2,143,109 | 52.9% |
[ 0.0% - 0.5% ] 0.32% | 1,354,633 | 50.9% |
[ 0.0% - 0.5% ] 0.39% | 837,194 | 52.0% |
[ 0.0% - 0.5% ] 0.46% | 614,643 | 50.4% |
[ 0.5% - 1.0% ] 0.54% | 578,024 | 47.8% |
[ 0.5% - 1.0% ] 0.61% | 426,557 | 51.6% |
[ 0.5% - 1.0% ] 0.69% | 267,727 | 56.5% |
[ 0.5% - 1.0% ] 0.74% | 161,538 | 53.4% |
[ 0.5% - 1.0% ] 0.82% | 26,784 | 57.8% |
[ 0.5% - 1.0% ] 0.89% | 49,687 | 48.8% |
[ 0.5% - 1.0% ] 0.96% | 24,137 | 51.4% |
[ 1.0% - 1.5% ] 1.09% | 18,392 | 52.7% |
[ 1.0% - 1.5% ] 1.17% | 66,849 | 52.6% |
[ 1.0% - 1.5% ] 1.26% | 41,770 | 55.2% |
[ 1.0% - 1.5% ] 1.33% | 113,708 | 52.2% |
[ 1.0% - 1.5% ] 1.40% | 14,537 | 47.9% |
[ 1.0% - 1.5% ] 1.48% | 13,028 | 47.3% |
[ 1.5% - 2.0% ] 1.54% | 22,298 | 61.0% |
[ 1.5% - 2.0% ] 1.64% | 1,646 | 61.5% |
[ 1.5% - 2.0% ] 1.69% | 3,786 | 61.4% |
[ 1.5% - 2.0% ] 1.82% | 2,147 | 58.3% |
[ 1.5% - 2.0% ] 1.91% | 12,442 | 61.8% |
[ 1.5% - 2.0% ] 1.95% | 10,141 | 60.7% |
[ 2.0% - 2.5% ] 2.01% | 3,331 | 56.2% |
[ 2.0% - 2.5% ] 2.23% | 21,366 | 47.1% |
[ 2.0% - 2.5% ] 2.34% | 811 | 55.0% |
[ 2.0% - 2.5% ] 2.38% | 5,852 | 35.0% |
[ 2.0% - 2.5% ] 2.48% | 4,727 | 72.1% |
[ 2.5% - 3.0% ] 2.53% | 4,267 | 52.1% |
[ 2.5% - 3.0% ] 2.61% | 9,172 | 69.2% |
[ 2.5% - 3.0% ] 2.68% | 1,456 | 79.8% |
[ 2.5% - 3.0% ] 2.76% | 11,776 | 53.5% |
[ 2.5% - 3.0% ] 2.80% | 2,826 | 58.3% |
[ 3.0% - 3.5% ] 3.29% | 1,552 | 70.1% |
[ 3.5% - 4.0% ] 3.92% | 6,483 | 50.2% |
[ 4.0% - 4.5% ] 4.48% | 67 | 30.0% |
[ 4.5% - 5.0% ] 4.83% | 2,877 | 23.8% |
[ 5.0% - 5.5% ] 5.03% | 1,233 | 45.9% |
[ 5.0% - 5.5% ] 5.34% | 1,462 | 61.5% |
[ 5.0% - 5.5% ] 5.49% | 164 | 32.9% |
[ 5.5% - 6.0% ] 5.68% | 5,231 | 60.1% |
[ 5.5% - 6.0% ] 5.73% | 349 | 25.4% |
[ 6.0% - 6.5% ] 6.19% | 4,800 | 66.7% |
[ 14.0% - 14.5% ] 14.29% | 42 | 100.0% |
[ 21.0% - 21.5% ] 21.19% | 151 | 63.2% |