Maltese Married-Couple Family Poverty

COMPARE

Maltese
Race
Ancestry
AfghanAfricanAlaska NativeAlaskan AthabascanAlbanianAleutAlsatianAmericanApacheArabArapahoArgentineanArmenianAssyrian/Chaldean/SyriacAustralianAustrianBahamianBangladeshiBarbadianBasqueBelgianBelizeanBermudanBhutaneseBlackfeetBolivianBrazilianBritishBritish West IndianBulgarianBurmeseCajunCambodianCanadianCape VerdeanCarpatho RusynCelticCentral AmericanCentral American IndianCherokeeCheyenneChickasawChileanChineseChippewaChoctawColombianColvilleComancheCosta RicanCreeCreekCroatianCrowCubanCypriotCzechCzechoslovakianDanishDelawareDominicanDutchDutch West IndianEastern EuropeanEcuadorianEgyptianEnglishEstonianEthiopianEuropeanFijianFilipinoFinnishFrenchFrench American IndianFrench CanadianGermanGerman RussianGhanaianGreekGuamanian/ChamorroGuatemalanGuyaneseHaitianHmongHonduranHopiHoumaHungarianIcelanderIndian (Asian)IndonesianInupiatIranianIraqiIrishIroquoisIsraeliItalianJamaicanJapaneseJordanianKenyanKiowaKoreanLaotianLatvianLebaneseLiberianLithuanianLumbeeLuxembourgerMacedonianMalaysianMalteseMarshalleseMenomineeMexicanMexican American IndianMongolianMoroccanNative HawaiianNavajoNepaleseNew ZealanderNicaraguanNigerianNorthern EuropeanNorwegianOkinawanOsageOttawaPaiutePakistaniPalestinianPanamanianParaguayanPennsylvania GermanPeruvianPimaPolishPortuguesePotawatomiPuebloPuerto RicanPuget Sound SalishRomanianRussianSalvadoranSamoanScandinavianScotch-IrishScottishSeminoleSenegaleseSerbianShoshoneSierra LeoneanSiouxSlavicSlovakSloveneSomaliSouth AfricanSouth AmericanSouth American IndianSoviet UnionSpaniardSpanishSpanish AmericanSpanish American IndianSri LankanSubsaharan AfricanSudaneseSwedishSwissSyrianTaiwaneseThaiTlingit-HaidaTohono O'OdhamTonganTrinidadian and TobagonianTsimshianTurkishU.S. Virgin IslanderUgandanUkrainianUruguayanUteVenezuelanVietnameseWelshWest IndianYakamaYaquiYugoslavianYumanYup'ikZimbabwean
Immigration
NonimmigrantsImmigrantsAfghanistanAfricaAlbaniaArgentinaArmeniaAsiaAustraliaAustriaBahamasBangladeshBarbadosBelarusBelgiumBelizeBoliviaBosnia and HerzegovinaBrazilBulgariaBurma/MyanmarCabo VerdeCambodiaCameroonCanadaCaribbeanCentral AmericaChileChinaColombiaCongoCosta RicaCroatiaCubaCzechoslovakiaDenmarkDominicaDominican RepublicEastern AfricaEastern AsiaEastern EuropeEcuadorEgyptEl SalvadorEnglandEritreaEthiopiaEuropeFijiFranceGermanyGhanaGreeceGrenadaGuatemalaGuyanaHaitiHondurasHong KongHungaryIndiaIndonesiaIranIraqIrelandIsraelItalyJamaicaJapanJordanKazakhstanKenyaKoreaKuwaitLaosLatin AmericaLatviaLebanonLiberiaLithuaniaMalaysiaMexicoMicronesiaMiddle AfricaMoldovaMoroccoNepalNetherlandsNicaraguaNigeriaNorth AmericaNorth MacedoniaNorthern AfricaNorthern EuropeNorwayOceaniaPakistanPanamaPeruPhilippinesPolandPortugalRomaniaRussiaSaudi ArabiaScotlandSenegalSerbiaSierra LeoneSingaporeSomaliaSouth AfricaSouth AmericaSouth Central AsiaSouth Eastern AsiaSouthern EuropeSpainSri LankaSt. Vincent and the GrenadinesSudanSwedenSwitzerlandSyriaTaiwanThailandTrinidad and TobagoTurkeyUgandaUkraineUruguayUzbekistanVenezuelaVietnamWest IndiesWestern AfricaWestern AsiaWestern EuropeYemenZaireZimbabweAzores
Select to Compare
Race
Ancestry
AfghanAfricanAlaska NativeAlaskan AthabascanAlbanianAleutAlsatianAmericanApacheArabArapahoArgentineanArmenianAssyrian/Chaldean/SyriacAustralianAustrianBahamianBangladeshiBarbadianBasqueBelgianBelizeanBermudanBhutaneseBlackfeetBolivianBrazilianBritishBritish West IndianBulgarianBurmeseCajunCambodianCanadianCape VerdeanCarpatho RusynCelticCentral AmericanCentral American IndianCherokeeCheyenneChickasawChileanChineseChippewaChoctawColombianColvilleComancheCosta RicanCreeCreekCroatianCrowCubanCypriotCzechCzechoslovakianDanishDelawareDominicanDutchDutch West IndianEastern EuropeanEcuadorianEgyptianEnglishEstonianEthiopianEuropeanFijianFilipinoFinnishFrenchFrench American IndianFrench CanadianGermanGerman RussianGhanaianGreekGuamanian/ChamorroGuatemalanGuyaneseHaitianHmongHonduranHopiHoumaHungarianIcelanderIndian (Asian)IndonesianInupiatIranianIraqiIrishIroquoisIsraeliItalianJamaicanJapaneseJordanianKenyanKiowaKoreanLaotianLatvianLebaneseLiberianLithuanianLumbeeLuxembourgerMacedonianMalaysianMarshalleseMenomineeMexicanMexican American IndianMongolianMoroccanNative HawaiianNavajoNepaleseNew ZealanderNicaraguanNigerianNorthern EuropeanNorwegianOkinawanOsageOttawaPaiutePakistaniPalestinianPanamanianParaguayanPennsylvania GermanPeruvianPimaPolishPortuguesePotawatomiPuebloPuerto RicanPuget Sound SalishRomanianRussianSalvadoranSamoanScandinavianScotch-IrishScottishSeminoleSenegaleseSerbianShoshoneSierra LeoneanSiouxSlavicSlovakSloveneSomaliSouth AfricanSouth AmericanSouth American IndianSoviet UnionSpaniardSpanishSpanish AmericanSpanish American IndianSri LankanSubsaharan AfricanSudaneseSwedishSwissSyrianTaiwaneseThaiTlingit-HaidaTohono O'OdhamTonganTrinidadian and TobagonianTsimshianTurkishU.S. Virgin IslanderUgandanUkrainianUruguayanUteVenezuelanVietnameseWelshWest IndianYakamaYaquiYugoslavianYumanYup'ikZimbabwean
Immigration
NonimmigrantsImmigrantsAfghanistanAfricaAlbaniaArgentinaArmeniaAsiaAustraliaAustriaBahamasBangladeshBarbadosBelarusBelgiumBelizeBoliviaBosnia and HerzegovinaBrazilBulgariaBurma/MyanmarCabo VerdeCambodiaCameroonCanadaCaribbeanCentral AmericaChileChinaColombiaCongoCosta RicaCroatiaCubaCzechoslovakiaDenmarkDominicaDominican RepublicEastern AfricaEastern AsiaEastern EuropeEcuadorEgyptEl SalvadorEnglandEritreaEthiopiaEuropeFijiFranceGermanyGhanaGreeceGrenadaGuatemalaGuyanaHaitiHondurasHong KongHungaryIndiaIndonesiaIranIraqIrelandIsraelItalyJamaicaJapanJordanKazakhstanKenyaKoreaKuwaitLaosLatin AmericaLatviaLebanonLiberiaLithuaniaMalaysiaMexicoMicronesiaMiddle AfricaMoldovaMoroccoNepalNetherlandsNicaraguaNigeriaNorth AmericaNorth MacedoniaNorthern AfricaNorthern EuropeNorwayOceaniaPakistanPanamaPeruPhilippinesPolandPortugalRomaniaRussiaSaudi ArabiaScotlandSenegalSerbiaSierra LeoneSingaporeSomaliaSouth AfricaSouth AmericaSouth Central AsiaSouth Eastern AsiaSouthern EuropeSpainSri LankaSt. Vincent and the GrenadinesSudanSwedenSwitzerlandSyriaTaiwanThailandTrinidad and TobagoTurkeyUgandaUkraineUruguayUzbekistanVenezuelaVietnamWest IndiesWestern AfricaWestern AsiaWestern EuropeYemenZaireZimbabweAzores
Married-Couple Family Poverty
Income
Poverty
Unemployment
Labor Participation
Family Structure
Vehicle Availability
Education Level
Disability

Maltese Married-Couple Family Poverty
Exceptional

4.1%
POVERTY | MARRIED-COUPLE FAMILIES
99.9/ 100
METRIC RATING
20th/ 347
METRIC RANK

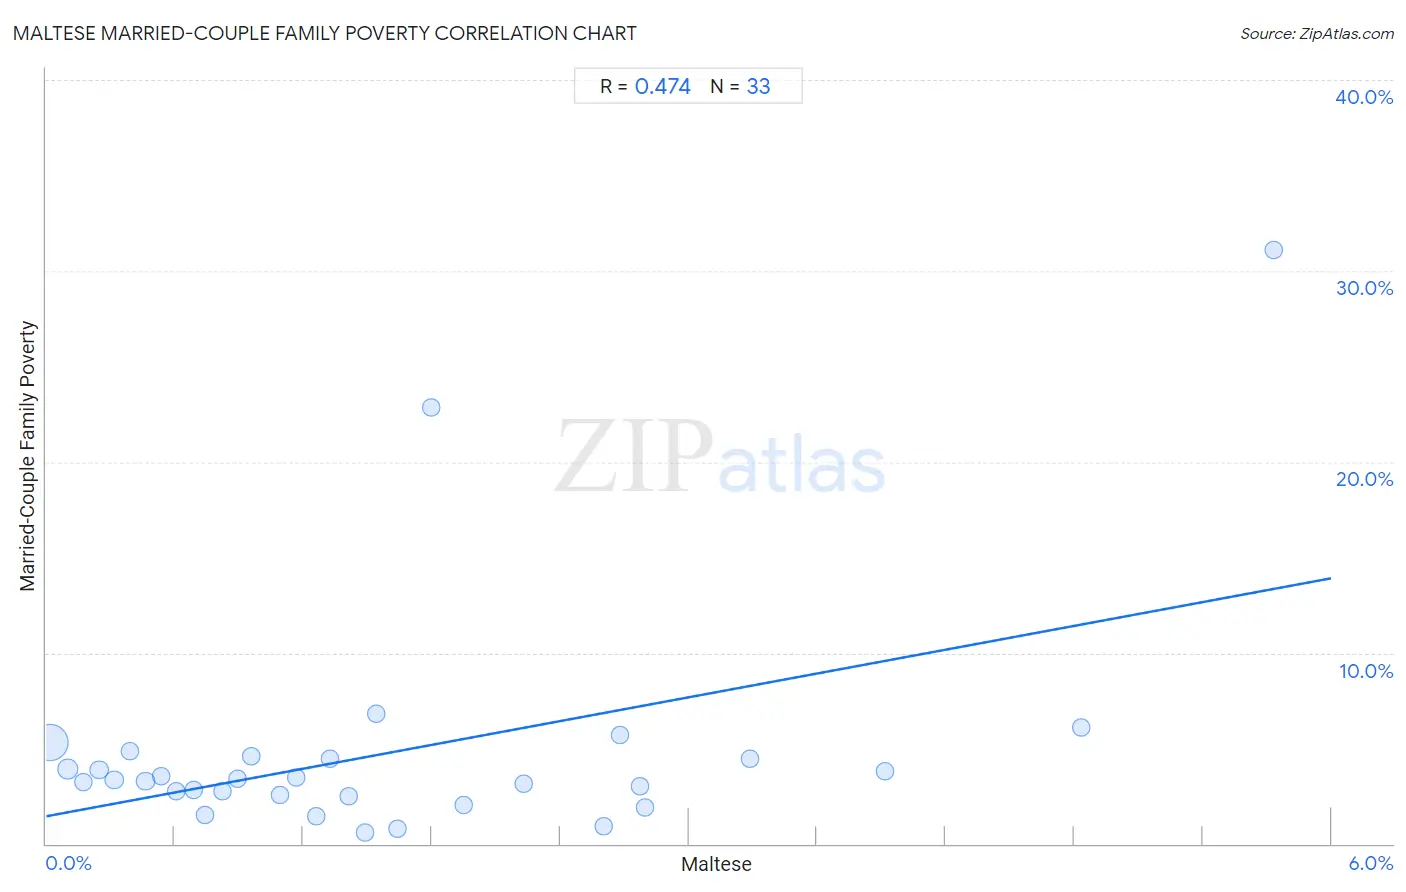
Maltese Married-Couple Family Poverty Correlation Chart

The statistical analysis conducted on geographies consisting of 125,965,353 people shows a moderate positive correlation between the proportion of Maltese and poverty level among married-couple families in the United States with a correlation coefficient (R) of 0.474 and weighted average of 4.1%. On average, for every 1% (one percent) increase in Maltese within a typical geography, there is an increase of 2.1% in poverty level among married-couple families.
Maltese Married-Couple Family Poverty
It is essential to understand that the correlation between the percentage of Maltese and poverty level among married-couple families does not imply a direct cause-and-effect relationship. It remains uncertain whether the presence of Maltese influences an upward or downward trend in the level of poverty level among married-couple families within an area, or if Maltese simply ended up residing in those areas with higher or lower levels of poverty level among married-couple families due to other factors.

Demographics Similar to Maltese by Married-Couple Family Poverty

In terms of married-couple family poverty, the demographic groups most similar to Maltese are Zimbabwean (4.1%, a difference of 0.030%), Immigrants from Ireland (4.1%, a difference of 0.25%), Immigrants from Singapore (4.1%, a difference of 0.40%), Bhutanese (4.1%, a difference of 0.42%), and Eastern European (4.1%, a difference of 0.65%).
DemographicsRating | RankMarried-Couple Family Poverty
Czechs
100.0
/100
|
#13
Exceptional
4.0%
Slovaks
100.0
/100
|
#14
Exceptional
4.0%
Poles
100.0
/100
|
#15
Exceptional
4.0%
Germans
100.0
/100
|
#16
Exceptional
4.0%
Filipinos
100.0
/100
|
#17
Exceptional
4.0%
Italians
100.0
/100
|
#18
Exceptional
4.0%
Immigrants from Ireland
99.9
/100
|
#19
Exceptional
4.1%
Maltese
99.9
/100
|
#20
Exceptional
4.1%
Zimbabweans
99.9
/100
|
#21
Exceptional
4.1%
Immigrants from Singapore
99.9
/100
|
#22
Exceptional
4.1%
Bhutanese
99.9
/100
|
#23
Exceptional
4.1%
Eastern Europeans
99.9
/100
|
#24
Exceptional
4.1%
Immigrants from Taiwan
99.9
/100
|
#25
Exceptional
4.1%
Cypriots
99.9
/100
|
#26
Exceptional
4.1%
Danes
99.9
/100
|
#27
Exceptional
4.1%

Maltese Married-Couple Family Poverty Correlation Summary

MeasurementMaltese DataMarried-Couple Family Poverty Data
Minimum0.020%0.56%
Maximum5.7%31.1%
Range5.7%30.6%
Mean1.6%4.7%
Median1.3%3.3%
Interquartile 25% (IQ1)0.57%2.5%
Interquartile 75% (IQ3)2.4%4.5%
Interquartile Range (IQR)1.8%2.0%
Standard Deviation (Sample)1.4%6.0%
Standard Deviation (Population)1.4%5.9%

Correlation Details

Maltese PercentileSample SizeMarried-Couple Family Poverty
[
0.0%
-
0.5%
]
0.020%
104,436,5565.3%
[
0.0%
-
0.5%
]
0.10%
10,721,8633.9%
[
0.0%
-
0.5%
]
0.17%
4,190,9873.2%
[
0.0%
-
0.5%
]
0.25%
2,104,9613.9%
[
0.0%
-
0.5%
]
0.32%
1,279,6823.3%
[
0.0%
-
0.5%
]
0.39%
801,6614.9%
[
0.0%
-
0.5%
]
0.46%
603,9093.3%
[
0.5%
-
1.0%
]
0.54%
569,1903.5%
[
0.5%
-
1.0%
]
0.61%
399,2322.8%
[
0.5%
-
1.0%
]
0.69%
266,1612.8%
[
0.5%
-
1.0%
]
0.74%
160,9911.5%
[
0.5%
-
1.0%
]
0.82%
25,5842.8%
[
0.5%
-
1.0%
]
0.89%
46,0103.4%
[
0.5%
-
1.0%
]
0.96%
16,5744.6%
[
1.0%
-
1.5%
]
1.09%
18,3922.6%
[
1.0%
-
1.5%
]
1.17%
66,8493.4%
[
1.0%
-
1.5%
]
1.26%
41,7701.4%
[
1.0%
-
1.5%
]
1.32%
110,3774.4%
[
1.0%
-
1.5%
]
1.41%
9,7762.5%
[
1.0%
-
1.5%
]
1.49%
9,3510.56%
[
1.5%
-
2.0%
]
1.54%
22,2986.8%
[
1.5%
-
2.0%
]
1.64%
1,6460.78%
[
1.5%
-
2.0%
]
1.80%
88922.8%
[
1.5%
-
2.0%
]
1.95%
7,0232.0%
[
2.0%
-
2.5%
]
2.23%
19,7783.1%
[
2.5%
-
3.0%
]
2.61%
9,1720.89%
[
2.5%
-
3.0%
]
2.68%
1,4565.7%
[
2.5%
-
3.0%
]
2.77%
9,1283.0%
[
2.5%
-
3.0%
]
2.80%
2,8261.9%
[
3.0%
-
3.5%
]
3.29%
1,5524.5%
[
3.5%
-
4.0%
]
3.92%
6,4833.8%
[
4.5%
-
5.0%
]
4.83%
2,8776.1%
[
5.5%
-
6.0%
]
5.73%
34931.1%