Maltese 4 or more Vehicles in Household

COMPARE

Maltese
Race
Ancestry
AfghanAfricanAlaska NativeAlaskan AthabascanAlbanianAleutAlsatianAmericanApacheArabArapahoArgentineanArmenianAssyrian/Chaldean/SyriacAustralianAustrianBahamianBangladeshiBarbadianBasqueBelgianBelizeanBermudanBhutaneseBlackfeetBolivianBrazilianBritishBritish West IndianBulgarianBurmeseCajunCambodianCanadianCape VerdeanCarpatho RusynCelticCentral AmericanCentral American IndianCherokeeCheyenneChickasawChileanChineseChippewaChoctawColombianColvilleComancheCosta RicanCreeCreekCroatianCrowCubanCypriotCzechCzechoslovakianDanishDelawareDominicanDutchDutch West IndianEastern EuropeanEcuadorianEgyptianEnglishEstonianEthiopianEuropeanFijianFilipinoFinnishFrenchFrench American IndianFrench CanadianGermanGerman RussianGhanaianGreekGuamanian/ChamorroGuatemalanGuyaneseHaitianHmongHonduranHopiHoumaHungarianIcelanderIndian (Asian)IndonesianInupiatIranianIraqiIrishIroquoisIsraeliItalianJamaicanJapaneseJordanianKenyanKiowaKoreanLaotianLatvianLebaneseLiberianLithuanianLumbeeLuxembourgerMacedonianMalaysianMalteseMarshalleseMenomineeMexicanMexican American IndianMongolianMoroccanNative HawaiianNavajoNepaleseNew ZealanderNicaraguanNigerianNorthern EuropeanNorwegianOkinawanOsageOttawaPaiutePakistaniPalestinianPanamanianParaguayanPennsylvania GermanPeruvianPimaPolishPortuguesePotawatomiPuebloPuerto RicanPuget Sound SalishRomanianRussianSalvadoranSamoanScandinavianScotch-IrishScottishSeminoleSenegaleseSerbianShoshoneSierra LeoneanSiouxSlavicSlovakSloveneSomaliSouth AfricanSouth AmericanSouth American IndianSoviet UnionSpaniardSpanishSpanish AmericanSpanish American IndianSri LankanSubsaharan AfricanSudaneseSwedishSwissSyrianTaiwaneseThaiTlingit-HaidaTohono O'OdhamTonganTrinidadian and TobagonianTsimshianTurkishU.S. Virgin IslanderUgandanUkrainianUruguayanUteVenezuelanVietnameseWelshWest IndianYakamaYaquiYugoslavianYumanYup'ikZimbabwean
Immigration
NonimmigrantsImmigrantsAfghanistanAfricaAlbaniaArgentinaArmeniaAsiaAustraliaAustriaBahamasBangladeshBarbadosBelarusBelgiumBelizeBoliviaBosnia and HerzegovinaBrazilBulgariaBurma/MyanmarCabo VerdeCambodiaCameroonCanadaCaribbeanCentral AmericaChileChinaColombiaCongoCosta RicaCroatiaCubaCzechoslovakiaDenmarkDominicaDominican RepublicEastern AfricaEastern AsiaEastern EuropeEcuadorEgyptEl SalvadorEnglandEritreaEthiopiaEuropeFijiFranceGermanyGhanaGreeceGrenadaGuatemalaGuyanaHaitiHondurasHong KongHungaryIndiaIndonesiaIranIraqIrelandIsraelItalyJamaicaJapanJordanKazakhstanKenyaKoreaKuwaitLaosLatin AmericaLatviaLebanonLiberiaLithuaniaMalaysiaMexicoMicronesiaMiddle AfricaMoldovaMoroccoNepalNetherlandsNicaraguaNigeriaNorth AmericaNorth MacedoniaNorthern AfricaNorthern EuropeNorwayOceaniaPakistanPanamaPeruPhilippinesPolandPortugalRomaniaRussiaSaudi ArabiaScotlandSenegalSerbiaSierra LeoneSingaporeSomaliaSouth AfricaSouth AmericaSouth Central AsiaSouth Eastern AsiaSouthern EuropeSpainSri LankaSt. Vincent and the GrenadinesSudanSwedenSwitzerlandSyriaTaiwanThailandTrinidad and TobagoTurkeyUgandaUkraineUruguayUzbekistanVenezuelaVietnamWest IndiesWestern AfricaWestern AsiaWestern EuropeYemenZaireZimbabweAzores
Select to Compare
Race
Ancestry
AfghanAfricanAlaska NativeAlaskan AthabascanAlbanianAleutAlsatianAmericanApacheArabArapahoArgentineanArmenianAssyrian/Chaldean/SyriacAustralianAustrianBahamianBangladeshiBarbadianBasqueBelgianBelizeanBermudanBhutaneseBlackfeetBolivianBrazilianBritishBritish West IndianBulgarianBurmeseCajunCambodianCanadianCape VerdeanCarpatho RusynCelticCentral AmericanCentral American IndianCherokeeCheyenneChickasawChileanChineseChippewaChoctawColombianColvilleComancheCosta RicanCreeCreekCroatianCrowCubanCypriotCzechCzechoslovakianDanishDelawareDominicanDutchDutch West IndianEastern EuropeanEcuadorianEgyptianEnglishEstonianEthiopianEuropeanFijianFilipinoFinnishFrenchFrench American IndianFrench CanadianGermanGerman RussianGhanaianGreekGuamanian/ChamorroGuatemalanGuyaneseHaitianHmongHonduranHopiHoumaHungarianIcelanderIndian (Asian)IndonesianInupiatIranianIraqiIrishIroquoisIsraeliItalianJamaicanJapaneseJordanianKenyanKiowaKoreanLaotianLatvianLebaneseLiberianLithuanianLumbeeLuxembourgerMacedonianMalaysianMarshalleseMenomineeMexicanMexican American IndianMongolianMoroccanNative HawaiianNavajoNepaleseNew ZealanderNicaraguanNigerianNorthern EuropeanNorwegianOkinawanOsageOttawaPaiutePakistaniPalestinianPanamanianParaguayanPennsylvania GermanPeruvianPimaPolishPortuguesePotawatomiPuebloPuerto RicanPuget Sound SalishRomanianRussianSalvadoranSamoanScandinavianScotch-IrishScottishSeminoleSenegaleseSerbianShoshoneSierra LeoneanSiouxSlavicSlovakSloveneSomaliSouth AfricanSouth AmericanSouth American IndianSoviet UnionSpaniardSpanishSpanish AmericanSpanish American IndianSri LankanSubsaharan AfricanSudaneseSwedishSwissSyrianTaiwaneseThaiTlingit-HaidaTohono O'OdhamTonganTrinidadian and TobagonianTsimshianTurkishU.S. Virgin IslanderUgandanUkrainianUruguayanUteVenezuelanVietnameseWelshWest IndianYakamaYaquiYugoslavianYumanYup'ikZimbabwean
Immigration
NonimmigrantsImmigrantsAfghanistanAfricaAlbaniaArgentinaArmeniaAsiaAustraliaAustriaBahamasBangladeshBarbadosBelarusBelgiumBelizeBoliviaBosnia and HerzegovinaBrazilBulgariaBurma/MyanmarCabo VerdeCambodiaCameroonCanadaCaribbeanCentral AmericaChileChinaColombiaCongoCosta RicaCroatiaCubaCzechoslovakiaDenmarkDominicaDominican RepublicEastern AfricaEastern AsiaEastern EuropeEcuadorEgyptEl SalvadorEnglandEritreaEthiopiaEuropeFijiFranceGermanyGhanaGreeceGrenadaGuatemalaGuyanaHaitiHondurasHong KongHungaryIndiaIndonesiaIranIraqIrelandIsraelItalyJamaicaJapanJordanKazakhstanKenyaKoreaKuwaitLaosLatin AmericaLatviaLebanonLiberiaLithuaniaMalaysiaMexicoMicronesiaMiddle AfricaMoldovaMoroccoNepalNetherlandsNicaraguaNigeriaNorth AmericaNorth MacedoniaNorthern AfricaNorthern EuropeNorwayOceaniaPakistanPanamaPeruPhilippinesPolandPortugalRomaniaRussiaSaudi ArabiaScotlandSenegalSerbiaSierra LeoneSingaporeSomaliaSouth AfricaSouth AmericaSouth Central AsiaSouth Eastern AsiaSouthern EuropeSpainSri LankaSt. Vincent and the GrenadinesSudanSwedenSwitzerlandSyriaTaiwanThailandTrinidad and TobagoTurkeyUgandaUkraineUruguayUzbekistanVenezuelaVietnamWest IndiesWestern AfricaWestern AsiaWestern EuropeYemenZaireZimbabweAzores
4 or more Vehicles in Household
Income
Poverty
Unemployment
Labor Participation
Family Structure
Vehicle Availability
Education Level
Disability

Maltese 4 or more Vehicles in Household
Excellent

6.7%
4+ VEHICLES AVAILABLE
88.4/ 100
METRIC RATING
131st/ 347
METRIC RANK

Maltese 4 or more Vehicles in Household Correlation Chart

The statistical analysis conducted on geographies consisting of 125,931,665 people shows a moderate positive correlation between the proportion of Maltese and percentage of households with 4 or more vehicles available in the United States with a correlation coefficient (R) of 0.491 and weighted average of 6.7%. On average, for every 1% (one percent) increase in Maltese within a typical geography, there is an increase of 0.46% in percentage of households with 4 or more vehicles available.
Maltese 4 or more Vehicles in Household
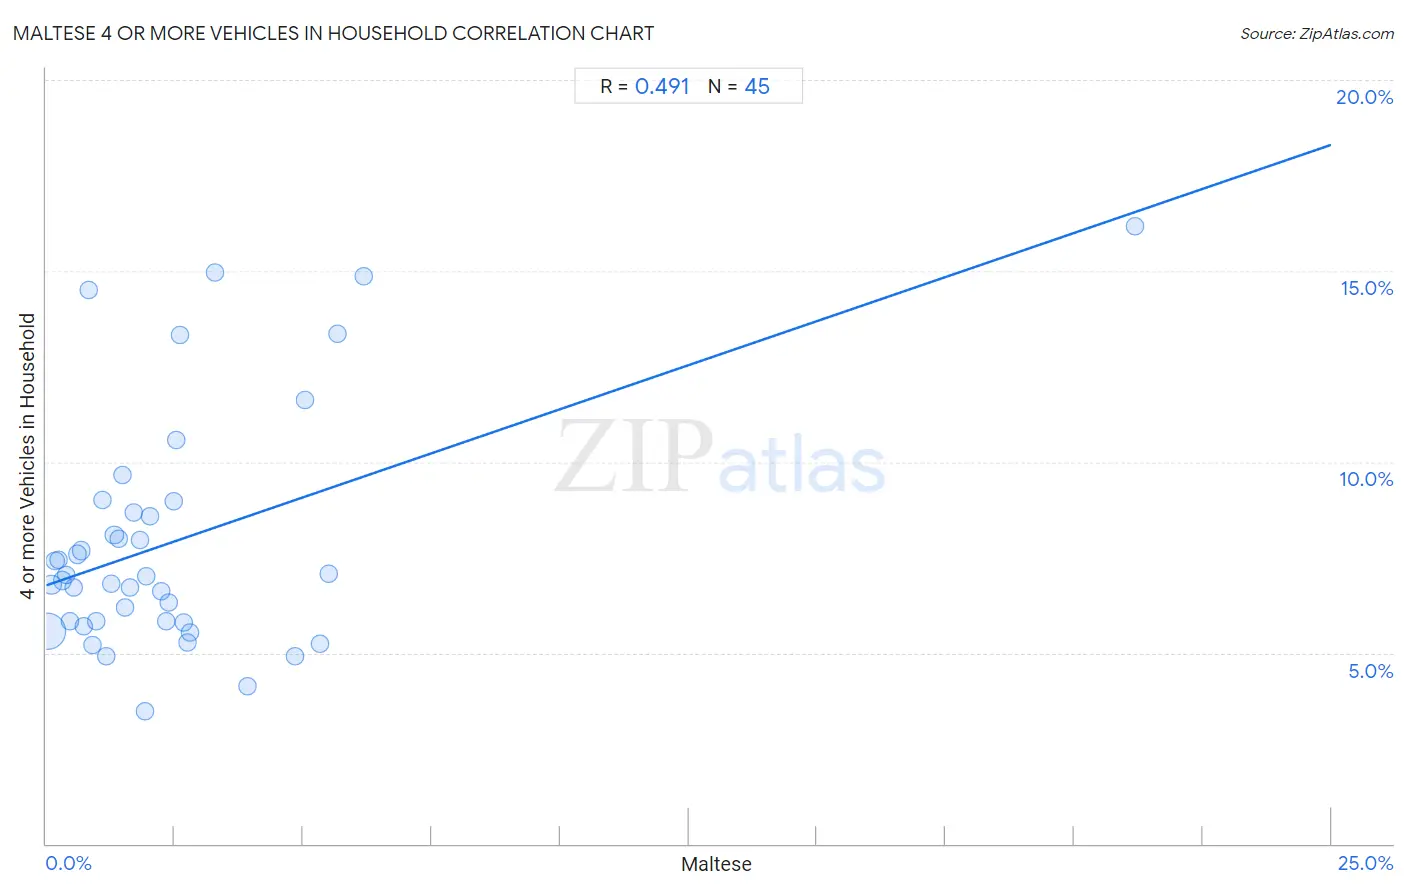
It is essential to understand that the correlation between the percentage of Maltese and percentage of households with 4 or more vehicles available does not imply a direct cause-and-effect relationship. It remains uncertain whether the presence of Maltese influences an upward or downward trend in the level of percentage of households with 4 or more vehicles available within an area, or if Maltese simply ended up residing in those areas with higher or lower levels of percentage of households with 4 or more vehicles available due to other factors.

Demographics Similar to Maltese by 4 or more Vehicles in Household

In terms of 4 or more vehicles in household, the demographic groups most similar to Maltese are Immigrants from Netherlands (6.6%, a difference of 0.14%), Immigrants from Scotland (6.7%, a difference of 0.15%), Armenian (6.6%, a difference of 0.34%), Ottawa (6.6%, a difference of 0.35%), and Tohono O'odham (6.6%, a difference of 0.38%).
DemographicsRating | Rank4 or more Vehicles in Household
Immigrants from Asia
94.4
/100
|
#124
Exceptional
6.8%
Austrians
94.1
/100
|
#125
Exceptional
6.8%
Belgians
94.1
/100
|
#126
Exceptional
6.8%
Immigrants from Korea
93.8
/100
|
#127
Exceptional
6.8%
Immigrants from Bolivia
92.5
/100
|
#128
Exceptional
6.7%
Immigrants from England
92.0
/100
|
#129
Exceptional
6.7%
Immigrants from Scotland
89.0
/100
|
#130
Excellent
6.7%
Maltese
88.4
/100
|
#131
Excellent
6.7%
Immigrants from Netherlands
87.8
/100
|
#132
Excellent
6.6%
Armenians
86.9
/100
|
#133
Excellent
6.6%
Ottawa
86.9
/100
|
#134
Excellent
6.6%
Tohono O'odham
86.7
/100
|
#135
Excellent
6.6%
Luxembourgers
86.4
/100
|
#136
Excellent
6.6%
French Canadians
85.4
/100
|
#137
Excellent
6.6%
Italians
84.5
/100
|
#138
Excellent
6.6%

Maltese 4 or more Vehicles in Household Correlation Summary

MeasurementMaltese Data4 or more Vehicles in Household Data
Minimum0.020%3.5%
Maximum21.2%16.2%
Range21.2%12.7%
Mean2.5%7.9%
Median1.7%7.0%
Interquartile 25% (IQ1)0.78%5.8%
Interquartile 75% (IQ3)2.7%8.8%
Interquartile Range (IQR)1.9%3.0%
Standard Deviation (Sample)3.3%3.1%
Standard Deviation (Population)3.2%3.1%

Correlation Details

Maltese PercentileSample Size4 or more Vehicles in Household
[
0.0%
-
0.5%
]
0.020%
104,332,5045.6%
[
0.0%
-
0.5%
]
0.10%
10,726,3236.8%
[
0.0%
-
0.5%
]
0.17%
4,133,8567.4%
[
0.0%
-
0.5%
]
0.25%
2,108,0327.4%
[
0.0%
-
0.5%
]
0.32%
1,254,5476.9%
[
0.0%
-
0.5%
]
0.39%
822,5837.0%
[
0.0%
-
0.5%
]
0.46%
614,2215.8%
[
0.5%
-
1.0%
]
0.54%
574,6296.7%
[
0.5%
-
1.0%
]
0.61%
424,5087.6%
[
0.5%
-
1.0%
]
0.69%
267,7277.7%
[
0.5%
-
1.0%
]
0.74%
161,5385.7%
[
0.5%
-
1.0%
]
0.82%
29,17914.5%
[
0.5%
-
1.0%
]
0.89%
49,6875.2%
[
0.5%
-
1.0%
]
0.96%
23,0745.8%
[
1.0%
-
1.5%
]
1.09%
18,3929.0%
[
1.0%
-
1.5%
]
1.17%
66,8494.9%
[
1.0%
-
1.5%
]
1.26%
41,7706.8%
[
1.0%
-
1.5%
]
1.33%
113,7088.1%
[
1.0%
-
1.5%
]
1.40%
14,5378.0%
[
1.0%
-
1.5%
]
1.48%
13,0289.7%
[
1.5%
-
2.0%
]
1.54%
22,2986.2%
[
1.5%
-
2.0%
]
1.64%
1,6466.7%
[
1.5%
-
2.0%
]
1.69%
3,7868.7%
[
1.5%
-
2.0%
]
1.82%
2,1478.0%
[
1.5%
-
2.0%
]
1.91%
12,4423.5%
[
1.5%
-
2.0%
]
1.95%
9,1177.0%
[
2.0%
-
2.5%
]
2.01%
3,3318.6%
[
2.0%
-
2.5%
]
2.23%
21,3666.6%
[
2.0%
-
2.5%
]
2.34%
8115.8%
[
2.0%
-
2.5%
]
2.38%
5,8526.3%
[
2.0%
-
2.5%
]
2.48%
4,7279.0%
[
2.5%
-
3.0%
]
2.53%
4,26710.6%
[
2.5%
-
3.0%
]
2.61%
9,17213.3%
[
2.5%
-
3.0%
]
2.68%
1,4565.8%
[
2.5%
-
3.0%
]
2.76%
11,7765.3%
[
2.5%
-
3.0%
]
2.80%
2,8265.5%
[
3.0%
-
3.5%
]
3.29%
1,55214.9%
[
3.5%
-
4.0%
]
3.92%
6,4834.1%
[
4.5%
-
5.0%
]
4.83%
2,8774.9%
[
5.0%
-
5.5%
]
5.03%
1,23311.6%
[
5.0%
-
5.5%
]
5.34%
1,4625.3%
[
5.0%
-
5.5%
]
5.49%
1647.1%
[
5.5%
-
6.0%
]
5.68%
5,23113.4%
[
6.0%
-
6.5%
]
6.19%
4,80014.9%
[
21.0%
-
21.5%
]
21.19%
15116.2%