Maltese Self-Care Disability

COMPARE

Maltese
Race
Ancestry
AfghanAfricanAlaska NativeAlaskan AthabascanAlbanianAleutAlsatianAmericanApacheArabArapahoArgentineanArmenianAssyrian/Chaldean/SyriacAustralianAustrianBahamianBangladeshiBarbadianBasqueBelgianBelizeanBermudanBhutaneseBlackfeetBolivianBrazilianBritishBritish West IndianBulgarianBurmeseCajunCambodianCanadianCape VerdeanCarpatho RusynCelticCentral AmericanCentral American IndianCherokeeCheyenneChickasawChileanChineseChippewaChoctawColombianColvilleComancheCosta RicanCreeCreekCroatianCrowCubanCypriotCzechCzechoslovakianDanishDelawareDominicanDutchDutch West IndianEastern EuropeanEcuadorianEgyptianEnglishEstonianEthiopianEuropeanFijianFilipinoFinnishFrenchFrench American IndianFrench CanadianGermanGerman RussianGhanaianGreekGuamanian/ChamorroGuatemalanGuyaneseHaitianHmongHonduranHopiHoumaHungarianIcelanderIndian (Asian)IndonesianInupiatIranianIraqiIrishIroquoisIsraeliItalianJamaicanJapaneseJordanianKenyanKiowaKoreanLaotianLatvianLebaneseLiberianLithuanianLumbeeLuxembourgerMacedonianMalaysianMalteseMarshalleseMenomineeMexicanMexican American IndianMongolianMoroccanNative HawaiianNavajoNepaleseNew ZealanderNicaraguanNigerianNorthern EuropeanNorwegianOkinawanOsageOttawaPaiutePakistaniPalestinianPanamanianParaguayanPennsylvania GermanPeruvianPimaPolishPortuguesePotawatomiPuebloPuerto RicanPuget Sound SalishRomanianRussianSalvadoranSamoanScandinavianScotch-IrishScottishSeminoleSenegaleseSerbianShoshoneSierra LeoneanSiouxSlavicSlovakSloveneSomaliSouth AfricanSouth AmericanSouth American IndianSoviet UnionSpaniardSpanishSpanish AmericanSpanish American IndianSri LankanSubsaharan AfricanSudaneseSwedishSwissSyrianTaiwaneseThaiTlingit-HaidaTohono O'OdhamTonganTrinidadian and TobagonianTsimshianTurkishU.S. Virgin IslanderUgandanUkrainianUruguayanUteVenezuelanVietnameseWelshWest IndianYakamaYaquiYugoslavianYumanYup'ikZimbabwean
Immigration
NonimmigrantsImmigrantsAfghanistanAfricaAlbaniaArgentinaArmeniaAsiaAustraliaAustriaBahamasBangladeshBarbadosBelarusBelgiumBelizeBoliviaBosnia and HerzegovinaBrazilBulgariaBurma/MyanmarCabo VerdeCambodiaCameroonCanadaCaribbeanCentral AmericaChileChinaColombiaCongoCosta RicaCroatiaCubaCzechoslovakiaDenmarkDominicaDominican RepublicEastern AfricaEastern AsiaEastern EuropeEcuadorEgyptEl SalvadorEnglandEritreaEthiopiaEuropeFijiFranceGermanyGhanaGreeceGrenadaGuatemalaGuyanaHaitiHondurasHong KongHungaryIndiaIndonesiaIranIraqIrelandIsraelItalyJamaicaJapanJordanKazakhstanKenyaKoreaKuwaitLaosLatin AmericaLatviaLebanonLiberiaLithuaniaMalaysiaMexicoMicronesiaMiddle AfricaMoldovaMoroccoNepalNetherlandsNicaraguaNigeriaNorth AmericaNorth MacedoniaNorthern AfricaNorthern EuropeNorwayOceaniaPakistanPanamaPeruPhilippinesPolandPortugalRomaniaRussiaSaudi ArabiaScotlandSenegalSerbiaSierra LeoneSingaporeSomaliaSouth AfricaSouth AmericaSouth Central AsiaSouth Eastern AsiaSouthern EuropeSpainSri LankaSt. Vincent and the GrenadinesSudanSwedenSwitzerlandSyriaTaiwanThailandTrinidad and TobagoTurkeyUgandaUkraineUruguayUzbekistanVenezuelaVietnamWest IndiesWestern AfricaWestern AsiaWestern EuropeYemenZaireZimbabweAzores
Select to Compare
Race
Ancestry
AfghanAfricanAlaska NativeAlaskan AthabascanAlbanianAleutAlsatianAmericanApacheArabArapahoArgentineanArmenianAssyrian/Chaldean/SyriacAustralianAustrianBahamianBangladeshiBarbadianBasqueBelgianBelizeanBermudanBhutaneseBlackfeetBolivianBrazilianBritishBritish West IndianBulgarianBurmeseCajunCambodianCanadianCape VerdeanCarpatho RusynCelticCentral AmericanCentral American IndianCherokeeCheyenneChickasawChileanChineseChippewaChoctawColombianColvilleComancheCosta RicanCreeCreekCroatianCrowCubanCypriotCzechCzechoslovakianDanishDelawareDominicanDutchDutch West IndianEastern EuropeanEcuadorianEgyptianEnglishEstonianEthiopianEuropeanFijianFilipinoFinnishFrenchFrench American IndianFrench CanadianGermanGerman RussianGhanaianGreekGuamanian/ChamorroGuatemalanGuyaneseHaitianHmongHonduranHopiHoumaHungarianIcelanderIndian (Asian)IndonesianInupiatIranianIraqiIrishIroquoisIsraeliItalianJamaicanJapaneseJordanianKenyanKiowaKoreanLaotianLatvianLebaneseLiberianLithuanianLumbeeLuxembourgerMacedonianMalaysianMarshalleseMenomineeMexicanMexican American IndianMongolianMoroccanNative HawaiianNavajoNepaleseNew ZealanderNicaraguanNigerianNorthern EuropeanNorwegianOkinawanOsageOttawaPaiutePakistaniPalestinianPanamanianParaguayanPennsylvania GermanPeruvianPimaPolishPortuguesePotawatomiPuebloPuerto RicanPuget Sound SalishRomanianRussianSalvadoranSamoanScandinavianScotch-IrishScottishSeminoleSenegaleseSerbianShoshoneSierra LeoneanSiouxSlavicSlovakSloveneSomaliSouth AfricanSouth AmericanSouth American IndianSoviet UnionSpaniardSpanishSpanish AmericanSpanish American IndianSri LankanSubsaharan AfricanSudaneseSwedishSwissSyrianTaiwaneseThaiTlingit-HaidaTohono O'OdhamTonganTrinidadian and TobagonianTsimshianTurkishU.S. Virgin IslanderUgandanUkrainianUruguayanUteVenezuelanVietnameseWelshWest IndianYakamaYaquiYugoslavianYumanYup'ikZimbabwean
Immigration
NonimmigrantsImmigrantsAfghanistanAfricaAlbaniaArgentinaArmeniaAsiaAustraliaAustriaBahamasBangladeshBarbadosBelarusBelgiumBelizeBoliviaBosnia and HerzegovinaBrazilBulgariaBurma/MyanmarCabo VerdeCambodiaCameroonCanadaCaribbeanCentral AmericaChileChinaColombiaCongoCosta RicaCroatiaCubaCzechoslovakiaDenmarkDominicaDominican RepublicEastern AfricaEastern AsiaEastern EuropeEcuadorEgyptEl SalvadorEnglandEritreaEthiopiaEuropeFijiFranceGermanyGhanaGreeceGrenadaGuatemalaGuyanaHaitiHondurasHong KongHungaryIndiaIndonesiaIranIraqIrelandIsraelItalyJamaicaJapanJordanKazakhstanKenyaKoreaKuwaitLaosLatin AmericaLatviaLebanonLiberiaLithuaniaMalaysiaMexicoMicronesiaMiddle AfricaMoldovaMoroccoNepalNetherlandsNicaraguaNigeriaNorth AmericaNorth MacedoniaNorthern AfricaNorthern EuropeNorwayOceaniaPakistanPanamaPeruPhilippinesPolandPortugalRomaniaRussiaSaudi ArabiaScotlandSenegalSerbiaSierra LeoneSingaporeSomaliaSouth AfricaSouth AmericaSouth Central AsiaSouth Eastern AsiaSouthern EuropeSpainSri LankaSt. Vincent and the GrenadinesSudanSwedenSwitzerlandSyriaTaiwanThailandTrinidad and TobagoTurkeyUgandaUkraineUruguayUzbekistanVenezuelaVietnamWest IndiesWestern AfricaWestern AsiaWestern EuropeYemenZaireZimbabweAzores
Self-Care Disability
Income
Poverty
Unemployment
Labor Participation
Family Structure
Vehicle Availability
Education Level
Disability

Maltese Self-Care Disability
Fair

2.5%
SELF-CARE DISABILITY
37.5/ 100
METRIC RATING
182nd/ 347
METRIC RANK

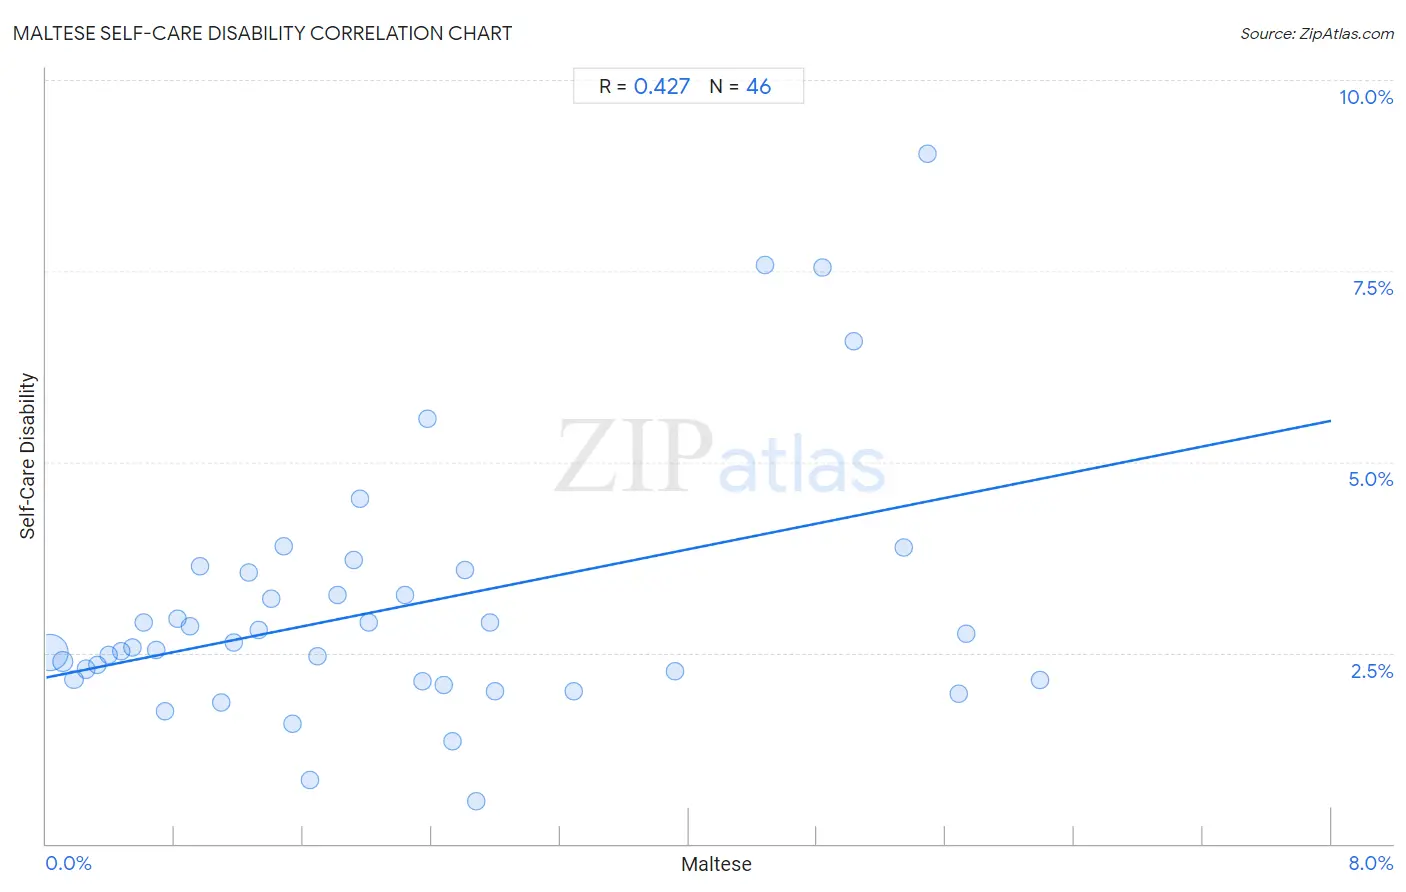
Maltese Self-Care Disability Correlation Chart

The statistical analysis conducted on geographies consisting of 126,446,361 people shows a moderate positive correlation between the proportion of Maltese and percentage of population with self-care disability in the United States with a correlation coefficient (R) of 0.427 and weighted average of 2.5%. On average, for every 1% (one percent) increase in Maltese within a typical geography, there is an increase of 0.42% in percentage of population with self-care disability.
Maltese Self-Care Disability
It is essential to understand that the correlation between the percentage of Maltese and percentage of population with self-care disability does not imply a direct cause-and-effect relationship. It remains uncertain whether the presence of Maltese influences an upward or downward trend in the level of percentage of population with self-care disability within an area, or if Maltese simply ended up residing in those areas with higher or lower levels of percentage of population with self-care disability due to other factors.

Demographics Similar to Maltese by Self-Care Disability

In terms of self-care disability, the demographic groups most similar to Maltese are Salvadoran (2.5%, a difference of 0.050%), Yugoslavian (2.5%, a difference of 0.070%), Ghanaian (2.5%, a difference of 0.14%), Slavic (2.5%, a difference of 0.16%), and Indonesian (2.5%, a difference of 0.19%).
DemographicsRating | RankSelf-Care Disability
Immigrants from Bosnia and Herzegovina
49.6
/100
|
#175
Average
2.5%
Immigrants from Afghanistan
47.6
/100
|
#176
Average
2.5%
Immigrants from Kazakhstan
46.7
/100
|
#177
Average
2.5%
English
46.2
/100
|
#178
Average
2.5%
Hungarians
45.5
/100
|
#179
Average
2.5%
Indonesians
41.2
/100
|
#180
Average
2.5%
Ghanaians
40.4
/100
|
#181
Average
2.5%
Maltese
37.5
/100
|
#182
Fair
2.5%
Salvadorans
36.4
/100
|
#183
Fair
2.5%
Yugoslavians
36.1
/100
|
#184
Fair
2.5%
Slavs
34.3
/100
|
#185
Fair
2.5%
Immigrants from El Salvador
33.0
/100
|
#186
Fair
2.5%
Irish
28.7
/100
|
#187
Fair
2.5%
Immigrants from Oceania
28.3
/100
|
#188
Fair
2.5%
Immigrants from Eastern Europe
28.0
/100
|
#189
Fair
2.5%

Maltese Self-Care Disability Correlation Summary

MeasurementMaltese DataSelf-Care Disability Data
Minimum0.020%0.56%
Maximum6.2%9.0%
Range6.2%8.5%
Mean2.2%3.1%
Median1.8%2.6%
Interquartile 25% (IQ1)0.82%2.1%
Interquartile 75% (IQ3)2.8%3.5%
Interquartile Range (IQR)1.9%1.4%
Standard Deviation (Sample)1.7%1.7%
Standard Deviation (Population)1.7%1.7%

Correlation Details

Maltese PercentileSample SizeSelf-Care Disability
[
0.0%
-
0.5%
]
0.020%
104,512,3472.5%
[
0.0%
-
0.5%
]
0.10%
10,791,6952.4%
[
0.0%
-
0.5%
]
0.17%
4,239,8242.1%
[
0.0%
-
0.5%
]
0.25%
2,156,7902.3%
[
0.0%
-
0.5%
]
0.32%
1,354,6332.3%
[
0.0%
-
0.5%
]
0.39%
837,1942.5%
[
0.0%
-
0.5%
]
0.46%
614,6432.5%
[
0.5%
-
1.0%
]
0.54%
578,0242.6%
[
0.5%
-
1.0%
]
0.61%
423,1132.9%
[
0.5%
-
1.0%
]
0.69%
266,6662.5%
[
0.5%
-
1.0%
]
0.74%
161,5381.7%
[
0.5%
-
1.0%
]
0.82%
29,1792.9%
[
0.5%
-
1.0%
]
0.89%
49,6872.9%
[
0.5%
-
1.0%
]
0.96%
23,4233.6%
[
1.0%
-
1.5%
]
1.09%
18,3921.9%
[
1.0%
-
1.5%
]
1.17%
66,3482.6%
[
1.0%
-
1.5%
]
1.26%
41,7703.5%
[
1.0%
-
1.5%
]
1.33%
113,7082.8%
[
1.0%
-
1.5%
]
1.40%
14,5373.2%
[
1.0%
-
1.5%
]
1.48%
13,0283.9%
[
1.5%
-
2.0%
]
1.54%
19,8581.6%
[
1.5%
-
2.0%
]
1.64%
1,6460.84%
[
1.5%
-
2.0%
]
1.69%
3,7862.5%
[
1.5%
-
2.0%
]
1.82%
2,1473.3%
[
1.5%
-
2.0%
]
1.91%
12,4423.7%
[
1.5%
-
2.0%
]
1.95%
10,1414.5%
[
2.0%
-
2.5%
]
2.01%
3,3312.9%
[
2.0%
-
2.5%
]
2.23%
21,3663.3%
[
2.0%
-
2.5%
]
2.34%
8112.1%
[
2.0%
-
2.5%
]
2.38%
5,8525.6%
[
2.0%
-
2.5%
]
2.48%
4,7272.1%
[
2.5%
-
3.0%
]
2.53%
4,2671.3%
[
2.5%
-
3.0%
]
2.61%
9,1723.6%
[
2.5%
-
3.0%
]
2.68%
1,4560.56%
[
2.5%
-
3.0%
]
2.76%
11,7762.9%
[
2.5%
-
3.0%
]
2.80%
2,8262.0%
[
3.0%
-
3.5%
]
3.29%
1,5522.0%
[
3.5%
-
4.0%
]
3.92%
6,4832.3%
[
4.0%
-
4.5%
]
4.48%
677.6%
[
4.5%
-
5.0%
]
4.83%
2,8777.5%
[
5.0%
-
5.5%
]
5.03%
1,2336.6%
[
5.0%
-
5.5%
]
5.34%
1,4623.9%
[
5.0%
-
5.5%
]
5.49%
1649.0%
[
5.5%
-
6.0%
]
5.68%
5,2312.0%
[
5.5%
-
6.0%
]
5.73%
3492.8%
[
6.0%
-
6.5%
]
6.19%
4,8002.1%