Maltese Receiving Food Stamps

COMPARE

Maltese
Race
Ancestry
AfghanAfricanAlaska NativeAlaskan AthabascanAlbanianAleutAlsatianAmericanApacheArabArapahoArgentineanArmenianAssyrian/Chaldean/SyriacAustralianAustrianBahamianBangladeshiBarbadianBasqueBelgianBelizeanBermudanBhutaneseBlackfeetBolivianBrazilianBritishBritish West IndianBulgarianBurmeseCajunCambodianCanadianCape VerdeanCarpatho RusynCelticCentral AmericanCentral American IndianCherokeeCheyenneChickasawChileanChineseChippewaChoctawColombianColvilleComancheCosta RicanCreeCreekCroatianCrowCubanCypriotCzechCzechoslovakianDanishDelawareDominicanDutchDutch West IndianEastern EuropeanEcuadorianEgyptianEnglishEstonianEthiopianEuropeanFijianFilipinoFinnishFrenchFrench American IndianFrench CanadianGermanGerman RussianGhanaianGreekGuamanian/ChamorroGuatemalanGuyaneseHaitianHmongHonduranHopiHoumaHungarianIcelanderIndian (Asian)IndonesianInupiatIranianIraqiIrishIroquoisIsraeliItalianJamaicanJapaneseJordanianKenyanKiowaKoreanLaotianLatvianLebaneseLiberianLithuanianLumbeeLuxembourgerMacedonianMalaysianMalteseMarshalleseMenomineeMexicanMexican American IndianMongolianMoroccanNative HawaiianNavajoNepaleseNew ZealanderNicaraguanNigerianNorthern EuropeanNorwegianOkinawanOsageOttawaPaiutePakistaniPalestinianPanamanianParaguayanPennsylvania GermanPeruvianPimaPolishPortuguesePotawatomiPuebloPuerto RicanPuget Sound SalishRomanianRussianSalvadoranSamoanScandinavianScotch-IrishScottishSeminoleSenegaleseSerbianShoshoneSierra LeoneanSiouxSlavicSlovakSloveneSomaliSouth AfricanSouth AmericanSouth American IndianSoviet UnionSpaniardSpanishSpanish AmericanSpanish American IndianSri LankanSubsaharan AfricanSudaneseSwedishSwissSyrianTaiwaneseThaiTlingit-HaidaTohono O'OdhamTonganTrinidadian and TobagonianTsimshianTurkishU.S. Virgin IslanderUgandanUkrainianUruguayanUteVenezuelanVietnameseWelshWest IndianYakamaYaquiYugoslavianYumanYup'ikZimbabwean
Immigration
NonimmigrantsImmigrantsAfghanistanAfricaAlbaniaArgentinaArmeniaAsiaAustraliaAustriaBahamasBangladeshBarbadosBelarusBelgiumBelizeBoliviaBosnia and HerzegovinaBrazilBulgariaBurma/MyanmarCabo VerdeCambodiaCameroonCanadaCaribbeanCentral AmericaChileChinaColombiaCongoCosta RicaCroatiaCubaCzechoslovakiaDenmarkDominicaDominican RepublicEastern AfricaEastern AsiaEastern EuropeEcuadorEgyptEl SalvadorEnglandEritreaEthiopiaEuropeFijiFranceGermanyGhanaGreeceGrenadaGuatemalaGuyanaHaitiHondurasHong KongHungaryIndiaIndonesiaIranIraqIrelandIsraelItalyJamaicaJapanJordanKazakhstanKenyaKoreaKuwaitLaosLatin AmericaLatviaLebanonLiberiaLithuaniaMalaysiaMexicoMicronesiaMiddle AfricaMoldovaMoroccoNepalNetherlandsNicaraguaNigeriaNorth AmericaNorth MacedoniaNorthern AfricaNorthern EuropeNorwayOceaniaPakistanPanamaPeruPhilippinesPolandPortugalRomaniaRussiaSaudi ArabiaScotlandSenegalSerbiaSierra LeoneSingaporeSomaliaSouth AfricaSouth AmericaSouth Central AsiaSouth Eastern AsiaSouthern EuropeSpainSri LankaSt. Vincent and the GrenadinesSudanSwedenSwitzerlandSyriaTaiwanThailandTrinidad and TobagoTurkeyUgandaUkraineUruguayUzbekistanVenezuelaVietnamWest IndiesWestern AfricaWestern AsiaWestern EuropeYemenZaireZimbabweAzores
Select to Compare
Race
Ancestry
AfghanAfricanAlaska NativeAlaskan AthabascanAlbanianAleutAlsatianAmericanApacheArabArapahoArgentineanArmenianAssyrian/Chaldean/SyriacAustralianAustrianBahamianBangladeshiBarbadianBasqueBelgianBelizeanBermudanBhutaneseBlackfeetBolivianBrazilianBritishBritish West IndianBulgarianBurmeseCajunCambodianCanadianCape VerdeanCarpatho RusynCelticCentral AmericanCentral American IndianCherokeeCheyenneChickasawChileanChineseChippewaChoctawColombianColvilleComancheCosta RicanCreeCreekCroatianCrowCubanCypriotCzechCzechoslovakianDanishDelawareDominicanDutchDutch West IndianEastern EuropeanEcuadorianEgyptianEnglishEstonianEthiopianEuropeanFijianFilipinoFinnishFrenchFrench American IndianFrench CanadianGermanGerman RussianGhanaianGreekGuamanian/ChamorroGuatemalanGuyaneseHaitianHmongHonduranHopiHoumaHungarianIcelanderIndian (Asian)IndonesianInupiatIranianIraqiIrishIroquoisIsraeliItalianJamaicanJapaneseJordanianKenyanKiowaKoreanLaotianLatvianLebaneseLiberianLithuanianLumbeeLuxembourgerMacedonianMalaysianMarshalleseMenomineeMexicanMexican American IndianMongolianMoroccanNative HawaiianNavajoNepaleseNew ZealanderNicaraguanNigerianNorthern EuropeanNorwegianOkinawanOsageOttawaPaiutePakistaniPalestinianPanamanianParaguayanPennsylvania GermanPeruvianPimaPolishPortuguesePotawatomiPuebloPuerto RicanPuget Sound SalishRomanianRussianSalvadoranSamoanScandinavianScotch-IrishScottishSeminoleSenegaleseSerbianShoshoneSierra LeoneanSiouxSlavicSlovakSloveneSomaliSouth AfricanSouth AmericanSouth American IndianSoviet UnionSpaniardSpanishSpanish AmericanSpanish American IndianSri LankanSubsaharan AfricanSudaneseSwedishSwissSyrianTaiwaneseThaiTlingit-HaidaTohono O'OdhamTonganTrinidadian and TobagonianTsimshianTurkishU.S. Virgin IslanderUgandanUkrainianUruguayanUteVenezuelanVietnameseWelshWest IndianYakamaYaquiYugoslavianYumanYup'ikZimbabwean
Immigration
NonimmigrantsImmigrantsAfghanistanAfricaAlbaniaArgentinaArmeniaAsiaAustraliaAustriaBahamasBangladeshBarbadosBelarusBelgiumBelizeBoliviaBosnia and HerzegovinaBrazilBulgariaBurma/MyanmarCabo VerdeCambodiaCameroonCanadaCaribbeanCentral AmericaChileChinaColombiaCongoCosta RicaCroatiaCubaCzechoslovakiaDenmarkDominicaDominican RepublicEastern AfricaEastern AsiaEastern EuropeEcuadorEgyptEl SalvadorEnglandEritreaEthiopiaEuropeFijiFranceGermanyGhanaGreeceGrenadaGuatemalaGuyanaHaitiHondurasHong KongHungaryIndiaIndonesiaIranIraqIrelandIsraelItalyJamaicaJapanJordanKazakhstanKenyaKoreaKuwaitLaosLatin AmericaLatviaLebanonLiberiaLithuaniaMalaysiaMexicoMicronesiaMiddle AfricaMoldovaMoroccoNepalNetherlandsNicaraguaNigeriaNorth AmericaNorth MacedoniaNorthern AfricaNorthern EuropeNorwayOceaniaPakistanPanamaPeruPhilippinesPolandPortugalRomaniaRussiaSaudi ArabiaScotlandSenegalSerbiaSierra LeoneSingaporeSomaliaSouth AfricaSouth AmericaSouth Central AsiaSouth Eastern AsiaSouthern EuropeSpainSri LankaSt. Vincent and the GrenadinesSudanSwedenSwitzerlandSyriaTaiwanThailandTrinidad and TobagoTurkeyUgandaUkraineUruguayUzbekistanVenezuelaVietnamWest IndiesWestern AfricaWestern AsiaWestern EuropeYemenZaireZimbabweAzores
Receiving Food Stamps
Income
Poverty
Unemployment
Labor Participation
Family Structure
Vehicle Availability
Education Level
Disability

Maltese Receiving Food Stamps
Exceptional

8.9%
PUBLIC INCOME | FOOD STAMPS
99.9/ 100
METRIC RATING
14th/ 347
METRIC RANK

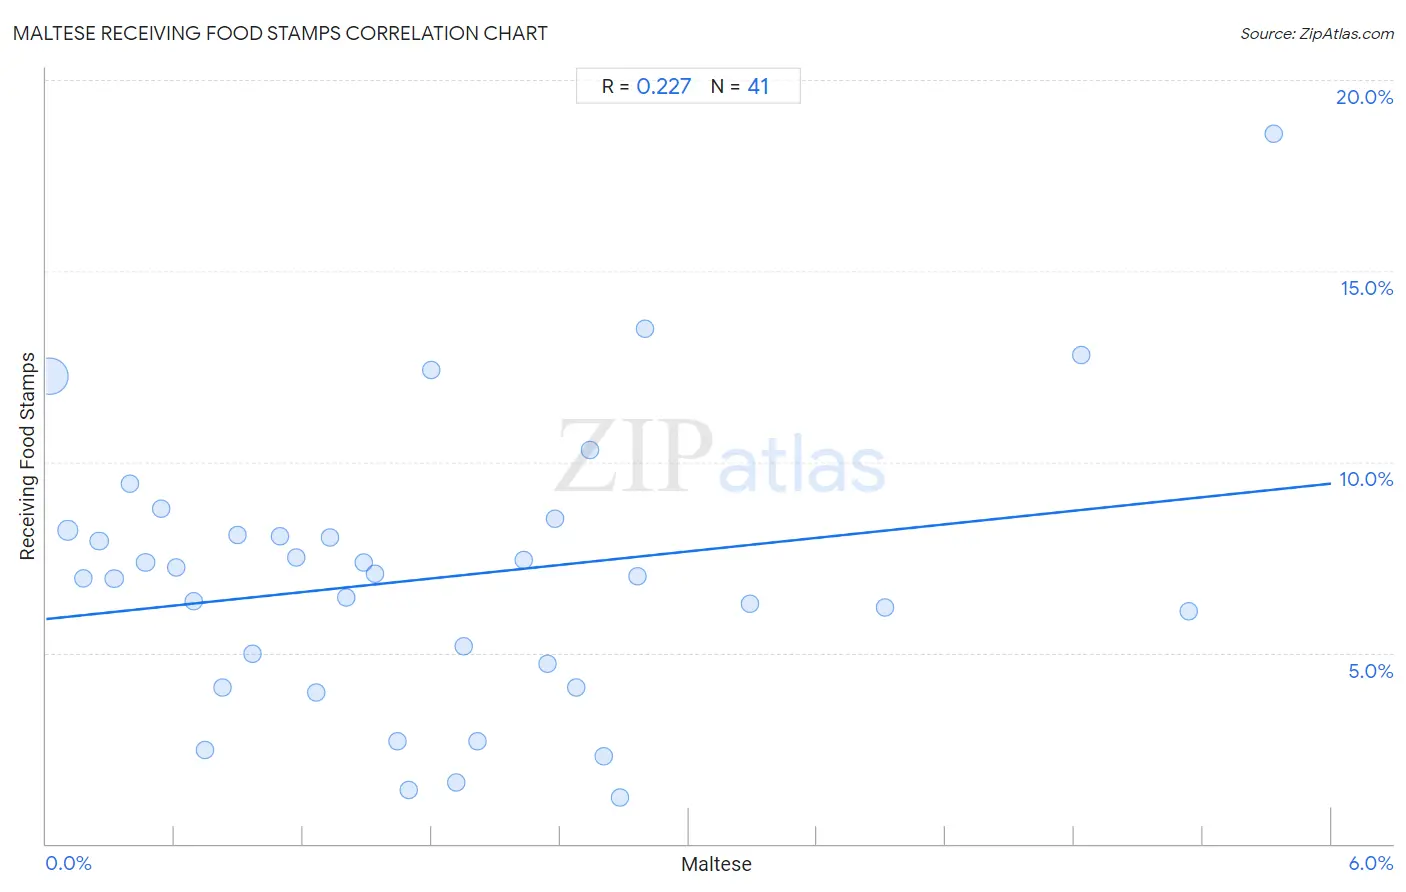
Maltese Receiving Food Stamps Correlation Chart

The statistical analysis conducted on geographies consisting of 126,326,632 people shows a weak positive correlation between the proportion of Maltese and percentage of population receiving government assistance and/or food stamps in the United States with a correlation coefficient (R) of 0.227 and weighted average of 8.9%. On average, for every 1% (one percent) increase in Maltese within a typical geography, there is an increase of 0.59% in percentage of population receiving government assistance and/or food stamps.
Maltese Receiving Food Stamps
It is essential to understand that the correlation between the percentage of Maltese and percentage of population receiving government assistance and/or food stamps does not imply a direct cause-and-effect relationship. It remains uncertain whether the presence of Maltese influences an upward or downward trend in the level of percentage of population receiving government assistance and/or food stamps within an area, or if Maltese simply ended up residing in those areas with higher or lower levels of percentage of population receiving government assistance and/or food stamps due to other factors.

Demographics Similar to Maltese by Receiving Food Stamps

In terms of receiving food stamps, the demographic groups most similar to Maltese are Bulgarian (8.9%, a difference of 0.13%), Okinawan (8.9%, a difference of 0.33%), Cypriot (8.9%, a difference of 0.33%), Norwegian (9.0%, a difference of 0.66%), and Immigrants from South Central Asia (8.8%, a difference of 0.77%).
DemographicsRating | RankReceiving Food Stamps
Immigrants from Iran
100.0
/100
|
#7
Exceptional
8.3%
Burmese
99.9
/100
|
#8
Exceptional
8.6%
Immigrants from Korea
99.9
/100
|
#9
Exceptional
8.7%
Immigrants from South Central Asia
99.9
/100
|
#10
Exceptional
8.8%
Okinawans
99.9
/100
|
#11
Exceptional
8.9%
Cypriots
99.9
/100
|
#12
Exceptional
8.9%
Bulgarians
99.9
/100
|
#13
Exceptional
8.9%
Maltese
99.9
/100
|
#14
Exceptional
8.9%
Norwegians
99.9
/100
|
#15
Exceptional
9.0%
Immigrants from Japan
99.9
/100
|
#16
Exceptional
9.0%
Immigrants from Scotland
99.9
/100
|
#17
Exceptional
9.0%
Danes
99.9
/100
|
#18
Exceptional
9.0%
Immigrants from Hong Kong
99.8
/100
|
#19
Exceptional
9.1%
Latvians
99.8
/100
|
#20
Exceptional
9.1%
Luxembourgers
99.8
/100
|
#21
Exceptional
9.1%

Maltese Receiving Food Stamps Correlation Summary

MeasurementMaltese DataReceiving Food Stamps Data
Minimum0.020%1.2%
Maximum5.7%18.6%
Range5.7%17.4%
Mean1.8%6.9%
Median1.5%7.0%
Interquartile 25% (IQ1)0.71%4.4%
Interquartile 75% (IQ3)2.5%8.2%
Interquartile Range (IQR)1.8%3.8%
Standard Deviation (Sample)1.4%3.6%
Standard Deviation (Population)1.4%3.5%

Correlation Details

Maltese PercentileSample SizeReceiving Food Stamps
[
0.0%
-
0.5%
]
0.020%
104,506,07712.2%
[
0.0%
-
0.5%
]
0.10%
10,748,4778.2%
[
0.0%
-
0.5%
]
0.17%
4,225,8337.0%
[
0.0%
-
0.5%
]
0.25%
2,130,9017.9%
[
0.0%
-
0.5%
]
0.32%
1,350,0707.0%
[
0.0%
-
0.5%
]
0.39%
835,1429.4%
[
0.0%
-
0.5%
]
0.46%
614,2217.4%
[
0.5%
-
1.0%
]
0.54%
578,0248.8%
[
0.5%
-
1.0%
]
0.61%
426,5577.2%
[
0.5%
-
1.0%
]
0.69%
263,4026.3%
[
0.5%
-
1.0%
]
0.74%
161,5382.4%
[
0.5%
-
1.0%
]
0.82%
26,7844.1%
[
0.5%
-
1.0%
]
0.89%
49,6878.1%
[
0.5%
-
1.0%
]
0.96%
24,1375.0%
[
1.0%
-
1.5%
]
1.09%
18,3928.0%
[
1.0%
-
1.5%
]
1.17%
66,8497.5%
[
1.0%
-
1.5%
]
1.26%
41,7704.0%
[
1.0%
-
1.5%
]
1.32%
110,2738.0%
[
1.0%
-
1.5%
]
1.40%
14,3926.4%
[
1.0%
-
1.5%
]
1.48%
13,0287.4%
[
1.5%
-
2.0%
]
1.54%
19,8587.1%
[
1.5%
-
2.0%
]
1.64%
1,6462.7%
[
1.5%
-
2.0%
]
1.69%
3,7861.4%
[
1.5%
-
2.0%
]
1.80%
88912.4%
[
1.5%
-
2.0%
]
1.91%
12,4421.6%
[
1.5%
-
2.0%
]
1.95%
7,0235.2%
[
2.0%
-
2.5%
]
2.01%
3,0812.7%
[
2.0%
-
2.5%
]
2.23%
19,7787.4%
[
2.0%
-
2.5%
]
2.34%
8114.7%
[
2.0%
-
2.5%
]
2.38%
5,8528.5%
[
2.0%
-
2.5%
]
2.48%
4,7274.1%
[
2.5%
-
3.0%
]
2.54%
3,23210.3%
[
2.5%
-
3.0%
]
2.61%
9,1722.3%
[
2.5%
-
3.0%
]
2.68%
1,4561.2%
[
2.5%
-
3.0%
]
2.76%
11,7767.0%
[
2.5%
-
3.0%
]
2.80%
2,82613.5%
[
3.0%
-
3.5%
]
3.29%
1,5526.3%
[
3.5%
-
4.0%
]
3.92%
6,4836.2%
[
4.5%
-
5.0%
]
4.83%
2,87712.8%
[
5.0%
-
5.5%
]
5.34%
1,4626.1%
[
5.5%
-
6.0%
]
5.73%
34918.6%