Maltese Unemployment Among Women with Children Ages 6 to 17 years
COMPARE
Maltese
Select to Compare
Unemployment Among Women with Children Ages 6 to 17 years
Maltese Unemployment Among Women with Children Ages 6 to 17 years
9.1%
UNEMPLOYMENT | WOMEN W/ CHILDREN 6 TO 17
15.3/ 100
METRIC RATING
203rd/ 347
METRIC RANK
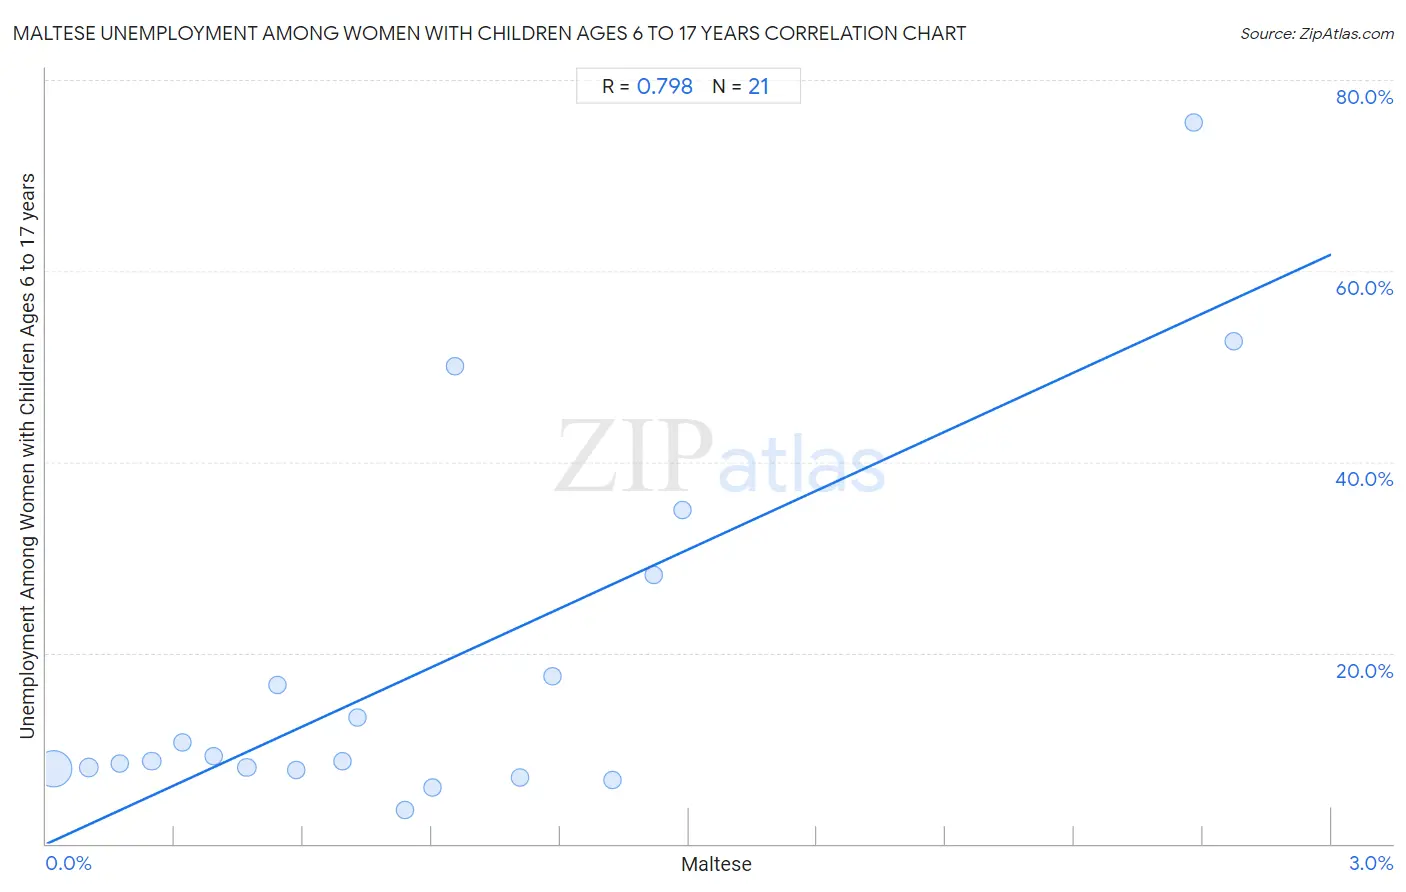
Maltese Unemployment Among Women with Children Ages 6 to 17 years Correlation Chart
The statistical analysis conducted on geographies consisting of 103,583,080 people shows a strong positive correlation between the proportion of Maltese and unemployment rate among women with children between the ages 6 and 17 in the United States with a correlation coefficient (R) of 0.798 and weighted average of 9.1%. On average, for every 1% (one percent) increase in Maltese within a typical geography, there is an increase of 20.6% in unemployment rate among women with children between the ages 6 and 17.
It is essential to understand that the correlation between the percentage of Maltese and unemployment rate among women with children between the ages 6 and 17 does not imply a direct cause-and-effect relationship. It remains uncertain whether the presence of Maltese influences an upward or downward trend in the level of unemployment rate among women with children between the ages 6 and 17 within an area, or if Maltese simply ended up residing in those areas with higher or lower levels of unemployment rate among women with children between the ages 6 and 17 due to other factors.
Demographics Similar to Maltese by Unemployment Among Women with Children Ages 6 to 17 years
In terms of unemployment among women with children ages 6 to 17 years, the demographic groups most similar to Maltese are Immigrants from Canada (9.1%, a difference of 0.0%), Immigrants from Middle Africa (9.1%, a difference of 0.020%), Immigrants from Trinidad and Tobago (9.1%, a difference of 0.11%), Immigrants from Western Europe (9.1%, a difference of 0.11%), and Trinidadian and Tobagonian (9.1%, a difference of 0.22%).
| Demographics | Rating | Rank | Unemployment Among Women with Children Ages 6 to 17 years |
| Brazilians | 24.4 /100 | #196 | Fair 9.1% |
| Immigrants from Panama | 24.3 /100 | #197 | Fair 9.1% |
| Guyanese | 21.8 /100 | #198 | Fair 9.1% |
| Czechoslovakians | 20.8 /100 | #199 | Fair 9.1% |
| Trinidadians and Tobagonians | 18.2 /100 | #200 | Poor 9.1% |
| Immigrants from Trinidad and Tobago | 16.7 /100 | #201 | Poor 9.1% |
| Immigrants from Middle Africa | 15.6 /100 | #202 | Poor 9.1% |
| Maltese | 15.3 /100 | #203 | Poor 9.1% |
| Immigrants from Canada | 15.3 /100 | #204 | Poor 9.1% |
| Immigrants from Western Europe | 14.1 /100 | #205 | Poor 9.1% |
| Immigrants from North America | 12.7 /100 | #206 | Poor 9.2% |
| Cubans | 10.9 /100 | #207 | Poor 9.2% |
| Immigrants from Peru | 10.8 /100 | #208 | Poor 9.2% |
| Salvadorans | 10.7 /100 | #209 | Poor 9.2% |
| Finns | 10.0 /100 | #210 | Tragic 9.2% |
Maltese Unemployment Among Women with Children Ages 6 to 17 years Correlation Summary
| Measurement | Maltese Data | Unemployment Among Women with Children Ages 6 to 17 years Data |
| Minimum | 0.018% | 3.5% |
| Maximum | 2.8% | 75.5% |
| Range | 2.8% | 72.0% |
| Mean | 0.90% | 18.5% |
| Median | 0.73% | 8.7% |
| Interquartile 25% (IQ1) | 0.35% | 7.8% |
| Interquartile 75% (IQ3) | 1.3% | 22.8% |
| Interquartile Range (IQR) | 0.90% | 15.1% |
| Standard Deviation (Sample) | 0.74% | 19.2% |
| Standard Deviation (Population) | 0.73% | 18.7% |
Correlation Details
| Maltese Percentile | Sample Size | Unemployment Among Women with Children Ages 6 to 17 years |
[ 0.0% - 0.5% ] 0.018% | 91,915,909 | 7.8% |
[ 0.0% - 0.5% ] 0.10% | 5,889,046 | 8.0% |
[ 0.0% - 0.5% ] 0.17% | 2,079,114 | 8.4% |
[ 0.0% - 0.5% ] 0.25% | 1,167,022 | 8.7% |
[ 0.0% - 0.5% ] 0.32% | 702,631 | 10.6% |
[ 0.0% - 0.5% ] 0.39% | 530,012 | 9.2% |
[ 0.0% - 0.5% ] 0.47% | 359,556 | 8.0% |
[ 0.5% - 1.0% ] 0.54% | 310,608 | 16.6% |
[ 0.5% - 1.0% ] 0.58% | 155,453 | 7.7% |
[ 0.5% - 1.0% ] 0.69% | 180,410 | 8.7% |
[ 0.5% - 1.0% ] 0.73% | 110,027 | 13.3% |
[ 0.5% - 1.0% ] 0.84% | 10,520 | 3.5% |
[ 0.5% - 1.0% ] 0.90% | 33,607 | 5.9% |
[ 0.5% - 1.0% ] 0.95% | 1,259 | 50.0% |
[ 1.0% - 1.5% ] 1.11% | 5,246 | 7.0% |
[ 1.0% - 1.5% ] 1.18% | 16,488 | 17.6% |
[ 1.0% - 1.5% ] 1.32% | 88,692 | 6.6% |
[ 1.0% - 1.5% ] 1.42% | 7,545 | 28.1% |
[ 1.0% - 1.5% ] 1.49% | 9,351 | 34.9% |
[ 2.5% - 3.0% ] 2.68% | 1,456 | 75.5% |
[ 2.5% - 3.0% ] 2.77% | 9,128 | 52.7% |