Maltese GED/Equivalency

COMPARE

Maltese
Race
Ancestry
AfghanAfricanAlaska NativeAlaskan AthabascanAlbanianAleutAlsatianAmericanApacheArabArapahoArgentineanArmenianAssyrian/Chaldean/SyriacAustralianAustrianBahamianBangladeshiBarbadianBasqueBelgianBelizeanBermudanBhutaneseBlackfeetBolivianBrazilianBritishBritish West IndianBulgarianBurmeseCajunCambodianCanadianCape VerdeanCarpatho RusynCelticCentral AmericanCentral American IndianCherokeeCheyenneChickasawChileanChineseChippewaChoctawColombianColvilleComancheCosta RicanCreeCreekCroatianCrowCubanCypriotCzechCzechoslovakianDanishDelawareDominicanDutchDutch West IndianEastern EuropeanEcuadorianEgyptianEnglishEstonianEthiopianEuropeanFijianFilipinoFinnishFrenchFrench American IndianFrench CanadianGermanGerman RussianGhanaianGreekGuamanian/ChamorroGuatemalanGuyaneseHaitianHmongHonduranHopiHoumaHungarianIcelanderIndian (Asian)IndonesianInupiatIranianIraqiIrishIroquoisIsraeliItalianJamaicanJapaneseJordanianKenyanKiowaKoreanLaotianLatvianLebaneseLiberianLithuanianLumbeeLuxembourgerMacedonianMalaysianMalteseMarshalleseMenomineeMexicanMexican American IndianMongolianMoroccanNative HawaiianNavajoNepaleseNew ZealanderNicaraguanNigerianNorthern EuropeanNorwegianOkinawanOsageOttawaPaiutePakistaniPalestinianPanamanianParaguayanPennsylvania GermanPeruvianPimaPolishPortuguesePotawatomiPuebloPuerto RicanPuget Sound SalishRomanianRussianSalvadoranSamoanScandinavianScotch-IrishScottishSeminoleSenegaleseSerbianShoshoneSierra LeoneanSiouxSlavicSlovakSloveneSomaliSouth AfricanSouth AmericanSouth American IndianSoviet UnionSpaniardSpanishSpanish AmericanSpanish American IndianSri LankanSubsaharan AfricanSudaneseSwedishSwissSyrianTaiwaneseThaiTlingit-HaidaTohono O'OdhamTonganTrinidadian and TobagonianTsimshianTurkishU.S. Virgin IslanderUgandanUkrainianUruguayanUteVenezuelanVietnameseWelshWest IndianYakamaYaquiYugoslavianYumanYup'ikZimbabwean
Immigration
NonimmigrantsImmigrantsAfghanistanAfricaAlbaniaArgentinaArmeniaAsiaAustraliaAustriaBahamasBangladeshBarbadosBelarusBelgiumBelizeBoliviaBosnia and HerzegovinaBrazilBulgariaBurma/MyanmarCabo VerdeCambodiaCameroonCanadaCaribbeanCentral AmericaChileChinaColombiaCongoCosta RicaCroatiaCubaCzechoslovakiaDenmarkDominicaDominican RepublicEastern AfricaEastern AsiaEastern EuropeEcuadorEgyptEl SalvadorEnglandEritreaEthiopiaEuropeFijiFranceGermanyGhanaGreeceGrenadaGuatemalaGuyanaHaitiHondurasHong KongHungaryIndiaIndonesiaIranIraqIrelandIsraelItalyJamaicaJapanJordanKazakhstanKenyaKoreaKuwaitLaosLatin AmericaLatviaLebanonLiberiaLithuaniaMalaysiaMexicoMicronesiaMiddle AfricaMoldovaMoroccoNepalNetherlandsNicaraguaNigeriaNorth AmericaNorth MacedoniaNorthern AfricaNorthern EuropeNorwayOceaniaPakistanPanamaPeruPhilippinesPolandPortugalRomaniaRussiaSaudi ArabiaScotlandSenegalSerbiaSierra LeoneSingaporeSomaliaSouth AfricaSouth AmericaSouth Central AsiaSouth Eastern AsiaSouthern EuropeSpainSri LankaSt. Vincent and the GrenadinesSudanSwedenSwitzerlandSyriaTaiwanThailandTrinidad and TobagoTurkeyUgandaUkraineUruguayUzbekistanVenezuelaVietnamWest IndiesWestern AfricaWestern AsiaWestern EuropeYemenZaireZimbabweAzores
Select to Compare
Race
Ancestry
AfghanAfricanAlaska NativeAlaskan AthabascanAlbanianAleutAlsatianAmericanApacheArabArapahoArgentineanArmenianAssyrian/Chaldean/SyriacAustralianAustrianBahamianBangladeshiBarbadianBasqueBelgianBelizeanBermudanBhutaneseBlackfeetBolivianBrazilianBritishBritish West IndianBulgarianBurmeseCajunCambodianCanadianCape VerdeanCarpatho RusynCelticCentral AmericanCentral American IndianCherokeeCheyenneChickasawChileanChineseChippewaChoctawColombianColvilleComancheCosta RicanCreeCreekCroatianCrowCubanCypriotCzechCzechoslovakianDanishDelawareDominicanDutchDutch West IndianEastern EuropeanEcuadorianEgyptianEnglishEstonianEthiopianEuropeanFijianFilipinoFinnishFrenchFrench American IndianFrench CanadianGermanGerman RussianGhanaianGreekGuamanian/ChamorroGuatemalanGuyaneseHaitianHmongHonduranHopiHoumaHungarianIcelanderIndian (Asian)IndonesianInupiatIranianIraqiIrishIroquoisIsraeliItalianJamaicanJapaneseJordanianKenyanKiowaKoreanLaotianLatvianLebaneseLiberianLithuanianLumbeeLuxembourgerMacedonianMalaysianMarshalleseMenomineeMexicanMexican American IndianMongolianMoroccanNative HawaiianNavajoNepaleseNew ZealanderNicaraguanNigerianNorthern EuropeanNorwegianOkinawanOsageOttawaPaiutePakistaniPalestinianPanamanianParaguayanPennsylvania GermanPeruvianPimaPolishPortuguesePotawatomiPuebloPuerto RicanPuget Sound SalishRomanianRussianSalvadoranSamoanScandinavianScotch-IrishScottishSeminoleSenegaleseSerbianShoshoneSierra LeoneanSiouxSlavicSlovakSloveneSomaliSouth AfricanSouth AmericanSouth American IndianSoviet UnionSpaniardSpanishSpanish AmericanSpanish American IndianSri LankanSubsaharan AfricanSudaneseSwedishSwissSyrianTaiwaneseThaiTlingit-HaidaTohono O'OdhamTonganTrinidadian and TobagonianTsimshianTurkishU.S. Virgin IslanderUgandanUkrainianUruguayanUteVenezuelanVietnameseWelshWest IndianYakamaYaquiYugoslavianYumanYup'ikZimbabwean
Immigration
NonimmigrantsImmigrantsAfghanistanAfricaAlbaniaArgentinaArmeniaAsiaAustraliaAustriaBahamasBangladeshBarbadosBelarusBelgiumBelizeBoliviaBosnia and HerzegovinaBrazilBulgariaBurma/MyanmarCabo VerdeCambodiaCameroonCanadaCaribbeanCentral AmericaChileChinaColombiaCongoCosta RicaCroatiaCubaCzechoslovakiaDenmarkDominicaDominican RepublicEastern AfricaEastern AsiaEastern EuropeEcuadorEgyptEl SalvadorEnglandEritreaEthiopiaEuropeFijiFranceGermanyGhanaGreeceGrenadaGuatemalaGuyanaHaitiHondurasHong KongHungaryIndiaIndonesiaIranIraqIrelandIsraelItalyJamaicaJapanJordanKazakhstanKenyaKoreaKuwaitLaosLatin AmericaLatviaLebanonLiberiaLithuaniaMalaysiaMexicoMicronesiaMiddle AfricaMoldovaMoroccoNepalNetherlandsNicaraguaNigeriaNorth AmericaNorth MacedoniaNorthern AfricaNorthern EuropeNorwayOceaniaPakistanPanamaPeruPhilippinesPolandPortugalRomaniaRussiaSaudi ArabiaScotlandSenegalSerbiaSierra LeoneSingaporeSomaliaSouth AfricaSouth AmericaSouth Central AsiaSouth Eastern AsiaSouthern EuropeSpainSri LankaSt. Vincent and the GrenadinesSudanSwedenSwitzerlandSyriaTaiwanThailandTrinidad and TobagoTurkeyUgandaUkraineUruguayUzbekistanVenezuelaVietnamWest IndiesWestern AfricaWestern AsiaWestern EuropeYemenZaireZimbabweAzores
GED/Equivalency
Income
Poverty
Unemployment
Labor Participation
Family Structure
Vehicle Availability
Education Level
Disability

Maltese GED/Equivalency
Exceptional

88.6%
GED/EQUIVALENCY
99.9/ 100
METRIC RATING
20th/ 347
METRIC RANK

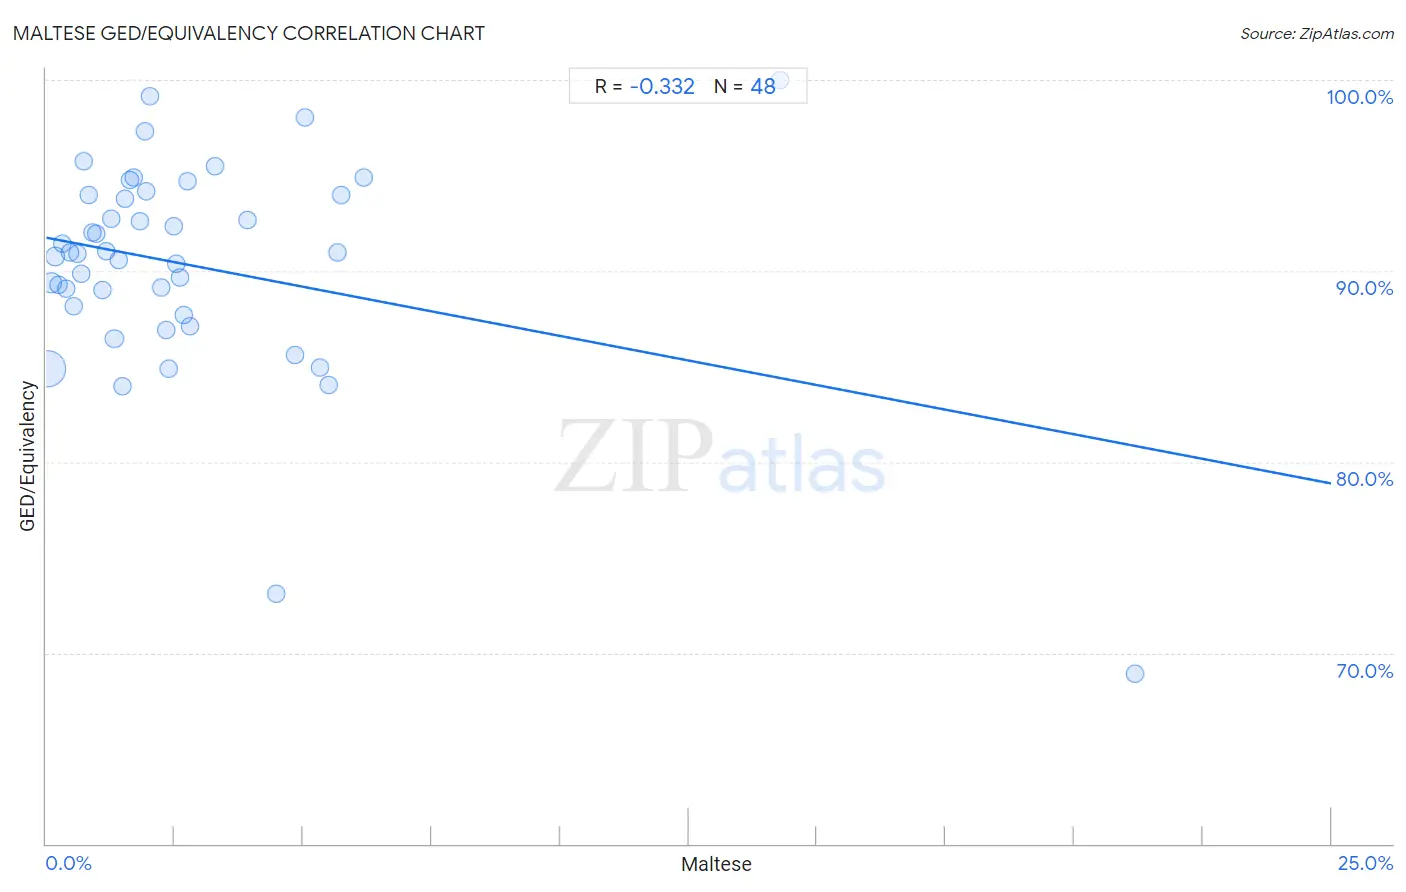
Maltese GED/Equivalency Correlation Chart

The statistical analysis conducted on geographies consisting of 126,478,070 people shows a mild negative correlation between the proportion of Maltese and percentage of population with at least ged/equivalency education in the United States with a correlation coefficient (R) of -0.332 and weighted average of 88.6%. On average, for every 1% (one percent) increase in Maltese within a typical geography, there is a decrease of 0.51% in percentage of population with at least ged/equivalency education.
Maltese GED/Equivalency
It is essential to understand that the correlation between the percentage of Maltese and percentage of population with at least ged/equivalency education does not imply a direct cause-and-effect relationship. It remains uncertain whether the presence of Maltese influences an upward or downward trend in the level of percentage of population with at least ged/equivalency education within an area, or if Maltese simply ended up residing in those areas with higher or lower levels of percentage of population with at least ged/equivalency education due to other factors.

Demographics Similar to Maltese by GED/Equivalency

In terms of ged/equivalency, the demographic groups most similar to Maltese are Luxembourger (88.6%, a difference of 0.010%), Immigrants from Ireland (88.6%, a difference of 0.020%), Russian (88.6%, a difference of 0.040%), Slovak (88.6%, a difference of 0.040%), and Estonian (88.6%, a difference of 0.040%).
DemographicsRating | RankGED/Equivalency
Immigrants from Iran
99.9
/100
|
#13
Exceptional
88.9%
Cypriots
99.9
/100
|
#14
Exceptional
88.9%
Okinawans
99.9
/100
|
#15
Exceptional
88.9%
Immigrants from Taiwan
99.9
/100
|
#16
Exceptional
88.8%
Croatians
99.9
/100
|
#17
Exceptional
88.8%
Slovenes
99.9
/100
|
#18
Exceptional
88.8%
Swedes
99.9
/100
|
#19
Exceptional
88.8%
Maltese
99.9
/100
|
#20
Exceptional
88.6%
Luxembourgers
99.8
/100
|
#21
Exceptional
88.6%
Immigrants from Ireland
99.8
/100
|
#22
Exceptional
88.6%
Russians
99.8
/100
|
#23
Exceptional
88.6%
Slovaks
99.8
/100
|
#24
Exceptional
88.6%
Estonians
99.8
/100
|
#25
Exceptional
88.6%
Immigrants from Australia
99.8
/100
|
#26
Exceptional
88.6%
Immigrants from Lithuania
99.8
/100
|
#27
Exceptional
88.6%

Maltese GED/Equivalency Correlation Summary

MeasurementMaltese DataGED/Equivalency Data
Minimum0.020%68.9%
Maximum21.2%100.0%
Range21.2%31.1%
Mean2.8%90.3%
Median1.9%90.9%
Interquartile 25% (IQ1)0.86%87.9%
Interquartile 75% (IQ3)3.0%94.0%
Interquartile Range (IQR)2.2%6.0%
Standard Deviation (Sample)3.6%5.7%
Standard Deviation (Population)3.6%5.6%

Correlation Details

Maltese PercentileSample SizeGED/Equivalency
[
0.0%
-
0.5%
]
0.020%
104,512,34784.9%
[
0.0%
-
0.5%
]
0.10%
10,804,86789.4%
[
0.0%
-
0.5%
]
0.17%
4,242,50690.8%
[
0.0%
-
0.5%
]
0.25%
2,160,12889.3%
[
0.0%
-
0.5%
]
0.32%
1,354,63391.5%
[
0.0%
-
0.5%
]
0.39%
837,19489.1%
[
0.0%
-
0.5%
]
0.46%
614,64391.0%
[
0.5%
-
1.0%
]
0.54%
578,02488.2%
[
0.5%
-
1.0%
]
0.61%
426,55790.9%
[
0.5%
-
1.0%
]
0.69%
271,89189.8%
[
0.5%
-
1.0%
]
0.74%
161,53895.7%
[
0.5%
-
1.0%
]
0.82%
29,17993.9%
[
0.5%
-
1.0%
]
0.89%
49,68792.0%
[
0.5%
-
1.0%
]
0.96%
24,13792.0%
[
1.0%
-
1.5%
]
1.09%
18,39289.0%
[
1.0%
-
1.5%
]
1.17%
66,84991.0%
[
1.0%
-
1.5%
]
1.26%
41,77092.7%
[
1.0%
-
1.5%
]
1.33%
113,70886.5%
[
1.0%
-
1.5%
]
1.40%
14,53790.6%
[
1.0%
-
1.5%
]
1.48%
13,02883.9%
[
1.5%
-
2.0%
]
1.54%
22,29893.8%
[
1.5%
-
2.0%
]
1.64%
1,64694.7%
[
1.5%
-
2.0%
]
1.69%
3,78694.9%
[
1.5%
-
2.0%
]
1.82%
2,14792.6%
[
1.5%
-
2.0%
]
1.91%
12,44297.3%
[
1.5%
-
2.0%
]
1.95%
10,14194.2%
[
2.0%
-
2.5%
]
2.01%
3,33199.1%
[
2.0%
-
2.5%
]
2.23%
21,36689.1%
[
2.0%
-
2.5%
]
2.34%
81186.9%
[
2.0%
-
2.5%
]
2.38%
5,85284.9%
[
2.0%
-
2.5%
]
2.48%
4,72792.3%
[
2.5%
-
3.0%
]
2.53%
4,26790.4%
[
2.5%
-
3.0%
]
2.61%
9,17289.7%
[
2.5%
-
3.0%
]
2.68%
1,45687.7%
[
2.5%
-
3.0%
]
2.76%
11,77694.7%
[
2.5%
-
3.0%
]
2.80%
2,82687.1%
[
3.0%
-
3.5%
]
3.29%
1,55295.5%
[
3.5%
-
4.0%
]
3.92%
6,48392.6%
[
4.0%
-
4.5%
]
4.48%
6773.1%
[
4.5%
-
5.0%
]
4.83%
2,87785.6%
[
5.0%
-
5.5%
]
5.03%
1,23398.1%
[
5.0%
-
5.5%
]
5.34%
1,46285.0%
[
5.0%
-
5.5%
]
5.49%
16484.0%
[
5.5%
-
6.0%
]
5.68%
5,23191.0%
[
5.5%
-
6.0%
]
5.73%
34994.0%
[
6.0%
-
6.5%
]
6.19%
4,80094.9%
[
14.0%
-
14.5%
]
14.29%
42100.0%
[
21.0%
-
21.5%
]
21.19%
15168.9%