Immigrants from Zaire Married-couple Households

COMPARE

Immigrants from Zaire
Race
Ancestry
AfghanAfricanAlaska NativeAlaskan AthabascanAlbanianAleutAlsatianAmericanApacheArabArapahoArgentineanArmenianAssyrian/Chaldean/SyriacAustralianAustrianBahamianBangladeshiBarbadianBasqueBelgianBelizeanBermudanBhutaneseBlackfeetBolivianBrazilianBritishBritish West IndianBulgarianBurmeseCajunCambodianCanadianCape VerdeanCarpatho RusynCelticCentral AmericanCentral American IndianCherokeeCheyenneChickasawChileanChineseChippewaChoctawColombianColvilleComancheCosta RicanCreeCreekCroatianCrowCubanCypriotCzechCzechoslovakianDanishDelawareDominicanDutchDutch West IndianEastern EuropeanEcuadorianEgyptianEnglishEstonianEthiopianEuropeanFijianFilipinoFinnishFrenchFrench American IndianFrench CanadianGermanGerman RussianGhanaianGreekGuamanian/ChamorroGuatemalanGuyaneseHaitianHmongHonduranHopiHoumaHungarianIcelanderIndian (Asian)IndonesianInupiatIranianIraqiIrishIroquoisIsraeliItalianJamaicanJapaneseJordanianKenyanKiowaKoreanLaotianLatvianLebaneseLiberianLithuanianLumbeeLuxembourgerMacedonianMalaysianMalteseMarshalleseMenomineeMexicanMexican American IndianMongolianMoroccanNative HawaiianNavajoNepaleseNew ZealanderNicaraguanNigerianNorthern EuropeanNorwegianOkinawanOsageOttawaPaiutePakistaniPalestinianPanamanianParaguayanPennsylvania GermanPeruvianPimaPolishPortuguesePotawatomiPuebloPuerto RicanPuget Sound SalishRomanianRussianSalvadoranSamoanScandinavianScotch-IrishScottishSeminoleSenegaleseSerbianShoshoneSierra LeoneanSiouxSlavicSlovakSloveneSomaliSouth AfricanSouth AmericanSouth American IndianSoviet UnionSpaniardSpanishSpanish AmericanSpanish American IndianSri LankanSubsaharan AfricanSudaneseSwedishSwissSyrianTaiwaneseThaiTlingit-HaidaTohono O'OdhamTonganTrinidadian and TobagonianTsimshianTurkishU.S. Virgin IslanderUgandanUkrainianUruguayanUteVenezuelanVietnameseWelshWest IndianYakamaYaquiYugoslavianYumanYup'ikZimbabwean
Immigration
NonimmigrantsImmigrantsAfghanistanAfricaAlbaniaArgentinaArmeniaAsiaAustraliaAustriaBahamasBangladeshBarbadosBelarusBelgiumBelizeBoliviaBosnia and HerzegovinaBrazilBulgariaBurma/MyanmarCabo VerdeCambodiaCameroonCanadaCaribbeanCentral AmericaChileChinaColombiaCongoCosta RicaCroatiaCubaCzechoslovakiaDenmarkDominicaDominican RepublicEastern AfricaEastern AsiaEastern EuropeEcuadorEgyptEl SalvadorEnglandEritreaEthiopiaEuropeFijiFranceGermanyGhanaGreeceGrenadaGuatemalaGuyanaHaitiHondurasHong KongHungaryIndiaIndonesiaIranIraqIrelandIsraelItalyJamaicaJapanJordanKazakhstanKenyaKoreaKuwaitLaosLatin AmericaLatviaLebanonLiberiaLithuaniaMalaysiaMexicoMicronesiaMiddle AfricaMoldovaMoroccoNepalNetherlandsNicaraguaNigeriaNorth AmericaNorth MacedoniaNorthern AfricaNorthern EuropeNorwayOceaniaPakistanPanamaPeruPhilippinesPolandPortugalRomaniaRussiaSaudi ArabiaScotlandSenegalSerbiaSierra LeoneSingaporeSomaliaSouth AfricaSouth AmericaSouth Central AsiaSouth Eastern AsiaSouthern EuropeSpainSri LankaSt. Vincent and the GrenadinesSudanSwedenSwitzerlandSyriaTaiwanThailandTrinidad and TobagoTurkeyUgandaUkraineUruguayUzbekistanVenezuelaVietnamWest IndiesWestern AfricaWestern AsiaWestern EuropeYemenZaireZimbabweAzores
Select to Compare
Race
Ancestry
AfghanAfricanAlaska NativeAlaskan AthabascanAlbanianAleutAlsatianAmericanApacheArabArapahoArgentineanArmenianAssyrian/Chaldean/SyriacAustralianAustrianBahamianBangladeshiBarbadianBasqueBelgianBelizeanBermudanBhutaneseBlackfeetBolivianBrazilianBritishBritish West IndianBulgarianBurmeseCajunCambodianCanadianCape VerdeanCarpatho RusynCelticCentral AmericanCentral American IndianCherokeeCheyenneChickasawChileanChineseChippewaChoctawColombianColvilleComancheCosta RicanCreeCreekCroatianCrowCubanCypriotCzechCzechoslovakianDanishDelawareDominicanDutchDutch West IndianEastern EuropeanEcuadorianEgyptianEnglishEstonianEthiopianEuropeanFijianFilipinoFinnishFrenchFrench American IndianFrench CanadianGermanGerman RussianGhanaianGreekGuamanian/ChamorroGuatemalanGuyaneseHaitianHmongHonduranHopiHoumaHungarianIcelanderIndian (Asian)IndonesianInupiatIranianIraqiIrishIroquoisIsraeliItalianJamaicanJapaneseJordanianKenyanKiowaKoreanLaotianLatvianLebaneseLiberianLithuanianLumbeeLuxembourgerMacedonianMalaysianMalteseMarshalleseMenomineeMexicanMexican American IndianMongolianMoroccanNative HawaiianNavajoNepaleseNew ZealanderNicaraguanNigerianNorthern EuropeanNorwegianOkinawanOsageOttawaPaiutePakistaniPalestinianPanamanianParaguayanPennsylvania GermanPeruvianPimaPolishPortuguesePotawatomiPuebloPuerto RicanPuget Sound SalishRomanianRussianSalvadoranSamoanScandinavianScotch-IrishScottishSeminoleSenegaleseSerbianShoshoneSierra LeoneanSiouxSlavicSlovakSloveneSomaliSouth AfricanSouth AmericanSouth American IndianSoviet UnionSpaniardSpanishSpanish AmericanSpanish American IndianSri LankanSubsaharan AfricanSudaneseSwedishSwissSyrianTaiwaneseThaiTlingit-HaidaTohono O'OdhamTonganTrinidadian and TobagonianTsimshianTurkishU.S. Virgin IslanderUgandanUkrainianUruguayanUteVenezuelanVietnameseWelshWest IndianYakamaYaquiYugoslavianYumanYup'ikZimbabwean
Immigration
NonimmigrantsImmigrantsAfghanistanAfricaAlbaniaArgentinaArmeniaAsiaAustraliaAustriaBahamasBangladeshBarbadosBelarusBelgiumBelizeBoliviaBosnia and HerzegovinaBrazilBulgariaBurma/MyanmarCabo VerdeCambodiaCameroonCanadaCaribbeanCentral AmericaChileChinaColombiaCongoCosta RicaCroatiaCubaCzechoslovakiaDenmarkDominicaDominican RepublicEastern AfricaEastern AsiaEastern EuropeEcuadorEgyptEl SalvadorEnglandEritreaEthiopiaEuropeFijiFranceGermanyGhanaGreeceGrenadaGuatemalaGuyanaHaitiHondurasHong KongHungaryIndiaIndonesiaIranIraqIrelandIsraelItalyJamaicaJapanJordanKazakhstanKenyaKoreaKuwaitLaosLatin AmericaLatviaLebanonLiberiaLithuaniaMalaysiaMexicoMicronesiaMiddle AfricaMoldovaMoroccoNepalNetherlandsNicaraguaNigeriaNorth AmericaNorth MacedoniaNorthern AfricaNorthern EuropeNorwayOceaniaPakistanPanamaPeruPhilippinesPolandPortugalRomaniaRussiaSaudi ArabiaScotlandSenegalSerbiaSierra LeoneSingaporeSomaliaSouth AfricaSouth AmericaSouth Central AsiaSouth Eastern AsiaSouthern EuropeSpainSri LankaSt. Vincent and the GrenadinesSudanSwedenSwitzerlandSyriaTaiwanThailandTrinidad and TobagoTurkeyUgandaUkraineUruguayUzbekistanVenezuelaVietnamWest IndiesWestern AfricaWestern AsiaWestern EuropeYemenZimbabweAzores
Married-couple Households
Income
Poverty
Unemployment
Labor Participation
Family Structure
Vehicle Availability
Education Level
Disability

Immigrants from Zaire Married-couple Households
Tragic

40.1%
MARRIED-COUPLE HOUSEHOLDS
0.0/ 100
METRIC RATING
322nd/ 347
METRIC RANK

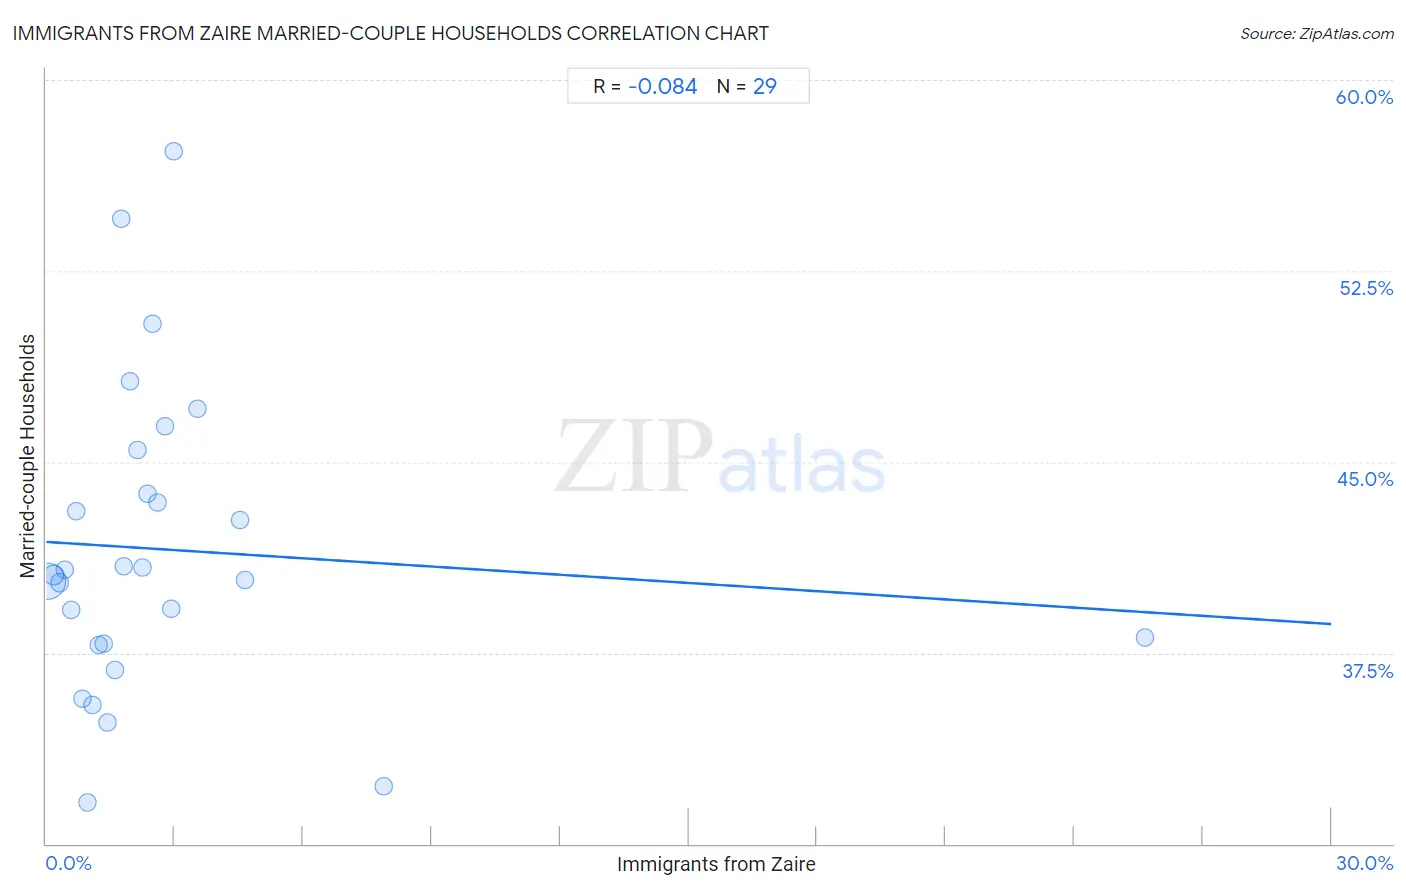
Immigrants from Zaire Married-couple Households Correlation Chart

The statistical analysis conducted on geographies consisting of 107,245,713 people shows a slight negative correlation between the proportion of Immigrants from Zaire and percentage of married-couple family households in the United States with a correlation coefficient (R) of -0.084 and weighted average of 40.1%. On average, for every 1% (one percent) increase in Immigrants from Zaire within a typical geography, there is a decrease of 0.11% in percentage of married-couple family households.
Immigrants from Zaire Married-couple Households
It is essential to understand that the correlation between the percentage of Immigrants from Zaire and percentage of married-couple family households does not imply a direct cause-and-effect relationship. It remains uncertain whether the presence of Immigrants from Zaire influences an upward or downward trend in the level of percentage of married-couple family households within an area, or if Immigrants from Zaire simply ended up residing in those areas with higher or lower levels of percentage of married-couple family households due to other factors.

Demographics Similar to Immigrants from Zaire by Married-couple Households

In terms of married-couple households, the demographic groups most similar to Immigrants from Zaire are Puerto Rican (40.1%, a difference of 0.0%), Navajo (40.1%, a difference of 0.010%), Pueblo (40.0%, a difference of 0.24%), Immigrants from Liberia (40.3%, a difference of 0.66%), and West Indian (40.3%, a difference of 0.70%).
DemographicsRating | RankMarried-couple Households
Trinidadians and Tobagonians
0.0
/100
|
#315
Tragic
40.9%
Immigrants from Caribbean
0.0
/100
|
#316
Tragic
40.8%
Immigrants from Jamaica
0.0
/100
|
#317
Tragic
40.7%
Liberians
0.0
/100
|
#318
Tragic
40.7%
Bahamians
0.0
/100
|
#319
Tragic
40.5%
West Indians
0.0
/100
|
#320
Tragic
40.3%
Immigrants from Liberia
0.0
/100
|
#321
Tragic
40.3%
Immigrants from Zaire
0.0
/100
|
#322
Tragic
40.1%
Puerto Ricans
0.0
/100
|
#323
Tragic
40.1%
Navajo
0.0
/100
|
#324
Tragic
40.1%
Pueblo
0.0
/100
|
#325
Tragic
40.0%
U.S. Virgin Islanders
0.0
/100
|
#326
Tragic
39.8%
Lumbee
0.0
/100
|
#327
Tragic
39.6%
Barbadians
0.0
/100
|
#328
Tragic
39.4%
Immigrants from Dominica
0.0
/100
|
#329
Tragic
39.4%

Immigrants from Zaire Married-couple Households Correlation Summary

MeasurementImmigrants from Zaire DataMarried-couple Households Data
Minimum0.034%31.6%
Maximum25.6%57.2%
Range25.6%25.6%
Mean2.9%41.6%
Median1.8%40.6%
Interquartile 25% (IQ1)0.90%37.8%
Interquartile 75% (IQ3)2.8%44.6%
Interquartile Range (IQR)1.9%6.8%
Standard Deviation (Sample)4.7%6.0%
Standard Deviation (Population)4.6%5.9%

Correlation Details

Immigrants from Zaire PercentileSample SizeMarried-couple Households
[
0.0%
-
0.5%
]
0.034%
85,966,50340.3%
[
0.0%
-
0.5%
]
0.18%
11,591,03340.6%
[
0.0%
-
0.5%
]
0.31%
3,926,07940.3%
[
0.0%
-
0.5%
]
0.44%
2,400,04840.8%
[
0.5%
-
1.0%
]
0.58%
924,93839.2%
[
0.5%
-
1.0%
]
0.69%
445,43043.0%
[
0.5%
-
1.0%
]
0.83%
452,78735.7%
[
0.5%
-
1.0%
]
0.97%
319,50931.6%
[
1.0%
-
1.5%
]
1.09%
351,58035.5%
[
1.0%
-
1.5%
]
1.24%
182,59237.8%
[
1.0%
-
1.5%
]
1.34%
152,27537.9%
[
1.0%
-
1.5%
]
1.44%
48,35534.7%
[
1.5%
-
2.0%
]
1.61%
92,43136.8%
[
1.5%
-
2.0%
]
1.74%
6,14854.5%
[
1.5%
-
2.0%
]
1.81%
22,86040.9%
[
1.5%
-
2.0%
]
1.96%
63,03548.2%
[
2.0%
-
2.5%
]
2.14%
37,92645.5%
[
2.0%
-
2.5%
]
2.26%
23,42840.9%
[
2.0%
-
2.5%
]
2.36%
36,39043.8%
[
2.0%
-
2.5%
]
2.48%
63,39450.4%
[
2.5%
-
3.0%
]
2.60%
12,36543.4%
[
2.5%
-
3.0%
]
2.76%
72446.4%
[
2.5%
-
3.0%
]
2.92%
67,13439.2%
[
2.5%
-
3.0%
]
2.98%
8,68157.2%
[
3.5%
-
4.0%
]
3.54%
4,80947.1%
[
4.5%
-
5.0%
]
4.52%
43,11042.7%
[
4.5%
-
5.0%
]
4.64%
1,20840.4%
[
7.5%
-
8.0%
]
7.88%
86332.2%
[
25.5%
-
26.0%
]
25.64%
7838.1%