Immigrants from Zaire 2 or more Vehicles in Household

COMPARE

Immigrants from Zaire
Race
Ancestry
AfghanAfricanAlaska NativeAlaskan AthabascanAlbanianAleutAlsatianAmericanApacheArabArapahoArgentineanArmenianAssyrian/Chaldean/SyriacAustralianAustrianBahamianBangladeshiBarbadianBasqueBelgianBelizeanBermudanBhutaneseBlackfeetBolivianBrazilianBritishBritish West IndianBulgarianBurmeseCajunCambodianCanadianCape VerdeanCarpatho RusynCelticCentral AmericanCentral American IndianCherokeeCheyenneChickasawChileanChineseChippewaChoctawColombianColvilleComancheCosta RicanCreeCreekCroatianCrowCubanCypriotCzechCzechoslovakianDanishDelawareDominicanDutchDutch West IndianEastern EuropeanEcuadorianEgyptianEnglishEstonianEthiopianEuropeanFijianFilipinoFinnishFrenchFrench American IndianFrench CanadianGermanGerman RussianGhanaianGreekGuamanian/ChamorroGuatemalanGuyaneseHaitianHmongHonduranHopiHoumaHungarianIcelanderIndian (Asian)IndonesianInupiatIranianIraqiIrishIroquoisIsraeliItalianJamaicanJapaneseJordanianKenyanKiowaKoreanLaotianLatvianLebaneseLiberianLithuanianLumbeeLuxembourgerMacedonianMalaysianMalteseMarshalleseMenomineeMexicanMexican American IndianMongolianMoroccanNative HawaiianNavajoNepaleseNew ZealanderNicaraguanNigerianNorthern EuropeanNorwegianOkinawanOsageOttawaPaiutePakistaniPalestinianPanamanianParaguayanPennsylvania GermanPeruvianPimaPolishPortuguesePotawatomiPuebloPuerto RicanPuget Sound SalishRomanianRussianSalvadoranSamoanScandinavianScotch-IrishScottishSeminoleSenegaleseSerbianShoshoneSierra LeoneanSiouxSlavicSlovakSloveneSomaliSouth AfricanSouth AmericanSouth American IndianSoviet UnionSpaniardSpanishSpanish AmericanSpanish American IndianSri LankanSubsaharan AfricanSudaneseSwedishSwissSyrianTaiwaneseThaiTlingit-HaidaTohono O'OdhamTonganTrinidadian and TobagonianTsimshianTurkishU.S. Virgin IslanderUgandanUkrainianUruguayanUteVenezuelanVietnameseWelshWest IndianYakamaYaquiYugoslavianYumanYup'ikZimbabwean
Immigration
NonimmigrantsImmigrantsAfghanistanAfricaAlbaniaArgentinaArmeniaAsiaAustraliaAustriaBahamasBangladeshBarbadosBelarusBelgiumBelizeBoliviaBosnia and HerzegovinaBrazilBulgariaBurma/MyanmarCabo VerdeCambodiaCameroonCanadaCaribbeanCentral AmericaChileChinaColombiaCongoCosta RicaCroatiaCubaCzechoslovakiaDenmarkDominicaDominican RepublicEastern AfricaEastern AsiaEastern EuropeEcuadorEgyptEl SalvadorEnglandEritreaEthiopiaEuropeFijiFranceGermanyGhanaGreeceGrenadaGuatemalaGuyanaHaitiHondurasHong KongHungaryIndiaIndonesiaIranIraqIrelandIsraelItalyJamaicaJapanJordanKazakhstanKenyaKoreaKuwaitLaosLatin AmericaLatviaLebanonLiberiaLithuaniaMalaysiaMexicoMicronesiaMiddle AfricaMoldovaMoroccoNepalNetherlandsNicaraguaNigeriaNorth AmericaNorth MacedoniaNorthern AfricaNorthern EuropeNorwayOceaniaPakistanPanamaPeruPhilippinesPolandPortugalRomaniaRussiaSaudi ArabiaScotlandSenegalSerbiaSierra LeoneSingaporeSomaliaSouth AfricaSouth AmericaSouth Central AsiaSouth Eastern AsiaSouthern EuropeSpainSri LankaSt. Vincent and the GrenadinesSudanSwedenSwitzerlandSyriaTaiwanThailandTrinidad and TobagoTurkeyUgandaUkraineUruguayUzbekistanVenezuelaVietnamWest IndiesWestern AfricaWestern AsiaWestern EuropeYemenZaireZimbabweAzores
Select to Compare
Race
Ancestry
AfghanAfricanAlaska NativeAlaskan AthabascanAlbanianAleutAlsatianAmericanApacheArabArapahoArgentineanArmenianAssyrian/Chaldean/SyriacAustralianAustrianBahamianBangladeshiBarbadianBasqueBelgianBelizeanBermudanBhutaneseBlackfeetBolivianBrazilianBritishBritish West IndianBulgarianBurmeseCajunCambodianCanadianCape VerdeanCarpatho RusynCelticCentral AmericanCentral American IndianCherokeeCheyenneChickasawChileanChineseChippewaChoctawColombianColvilleComancheCosta RicanCreeCreekCroatianCrowCubanCypriotCzechCzechoslovakianDanishDelawareDominicanDutchDutch West IndianEastern EuropeanEcuadorianEgyptianEnglishEstonianEthiopianEuropeanFijianFilipinoFinnishFrenchFrench American IndianFrench CanadianGermanGerman RussianGhanaianGreekGuamanian/ChamorroGuatemalanGuyaneseHaitianHmongHonduranHopiHoumaHungarianIcelanderIndian (Asian)IndonesianInupiatIranianIraqiIrishIroquoisIsraeliItalianJamaicanJapaneseJordanianKenyanKiowaKoreanLaotianLatvianLebaneseLiberianLithuanianLumbeeLuxembourgerMacedonianMalaysianMalteseMarshalleseMenomineeMexicanMexican American IndianMongolianMoroccanNative HawaiianNavajoNepaleseNew ZealanderNicaraguanNigerianNorthern EuropeanNorwegianOkinawanOsageOttawaPaiutePakistaniPalestinianPanamanianParaguayanPennsylvania GermanPeruvianPimaPolishPortuguesePotawatomiPuebloPuerto RicanPuget Sound SalishRomanianRussianSalvadoranSamoanScandinavianScotch-IrishScottishSeminoleSenegaleseSerbianShoshoneSierra LeoneanSiouxSlavicSlovakSloveneSomaliSouth AfricanSouth AmericanSouth American IndianSoviet UnionSpaniardSpanishSpanish AmericanSpanish American IndianSri LankanSubsaharan AfricanSudaneseSwedishSwissSyrianTaiwaneseThaiTlingit-HaidaTohono O'OdhamTonganTrinidadian and TobagonianTsimshianTurkishU.S. Virgin IslanderUgandanUkrainianUruguayanUteVenezuelanVietnameseWelshWest IndianYakamaYaquiYugoslavianYumanYup'ikZimbabwean
Immigration
NonimmigrantsImmigrantsAfghanistanAfricaAlbaniaArgentinaArmeniaAsiaAustraliaAustriaBahamasBangladeshBarbadosBelarusBelgiumBelizeBoliviaBosnia and HerzegovinaBrazilBulgariaBurma/MyanmarCabo VerdeCambodiaCameroonCanadaCaribbeanCentral AmericaChileChinaColombiaCongoCosta RicaCroatiaCubaCzechoslovakiaDenmarkDominicaDominican RepublicEastern AfricaEastern AsiaEastern EuropeEcuadorEgyptEl SalvadorEnglandEritreaEthiopiaEuropeFijiFranceGermanyGhanaGreeceGrenadaGuatemalaGuyanaHaitiHondurasHong KongHungaryIndiaIndonesiaIranIraqIrelandIsraelItalyJamaicaJapanJordanKazakhstanKenyaKoreaKuwaitLaosLatin AmericaLatviaLebanonLiberiaLithuaniaMalaysiaMexicoMicronesiaMiddle AfricaMoldovaMoroccoNepalNetherlandsNicaraguaNigeriaNorth AmericaNorth MacedoniaNorthern AfricaNorthern EuropeNorwayOceaniaPakistanPanamaPeruPhilippinesPolandPortugalRomaniaRussiaSaudi ArabiaScotlandSenegalSerbiaSierra LeoneSingaporeSomaliaSouth AfricaSouth AmericaSouth Central AsiaSouth Eastern AsiaSouthern EuropeSpainSri LankaSt. Vincent and the GrenadinesSudanSwedenSwitzerlandSyriaTaiwanThailandTrinidad and TobagoTurkeyUgandaUkraineUruguayUzbekistanVenezuelaVietnamWest IndiesWestern AfricaWestern AsiaWestern EuropeYemenZimbabweAzores
2 or more Vehicles in Household
Income
Poverty
Unemployment
Labor Participation
Family Structure
Vehicle Availability
Education Level
Disability

Immigrants from Zaire 2 or more Vehicles in Household
Tragic

51.5%
2+ VEHICLES AVAILABLE
0.1/ 100
METRIC RATING
284th/ 347
METRIC RANK

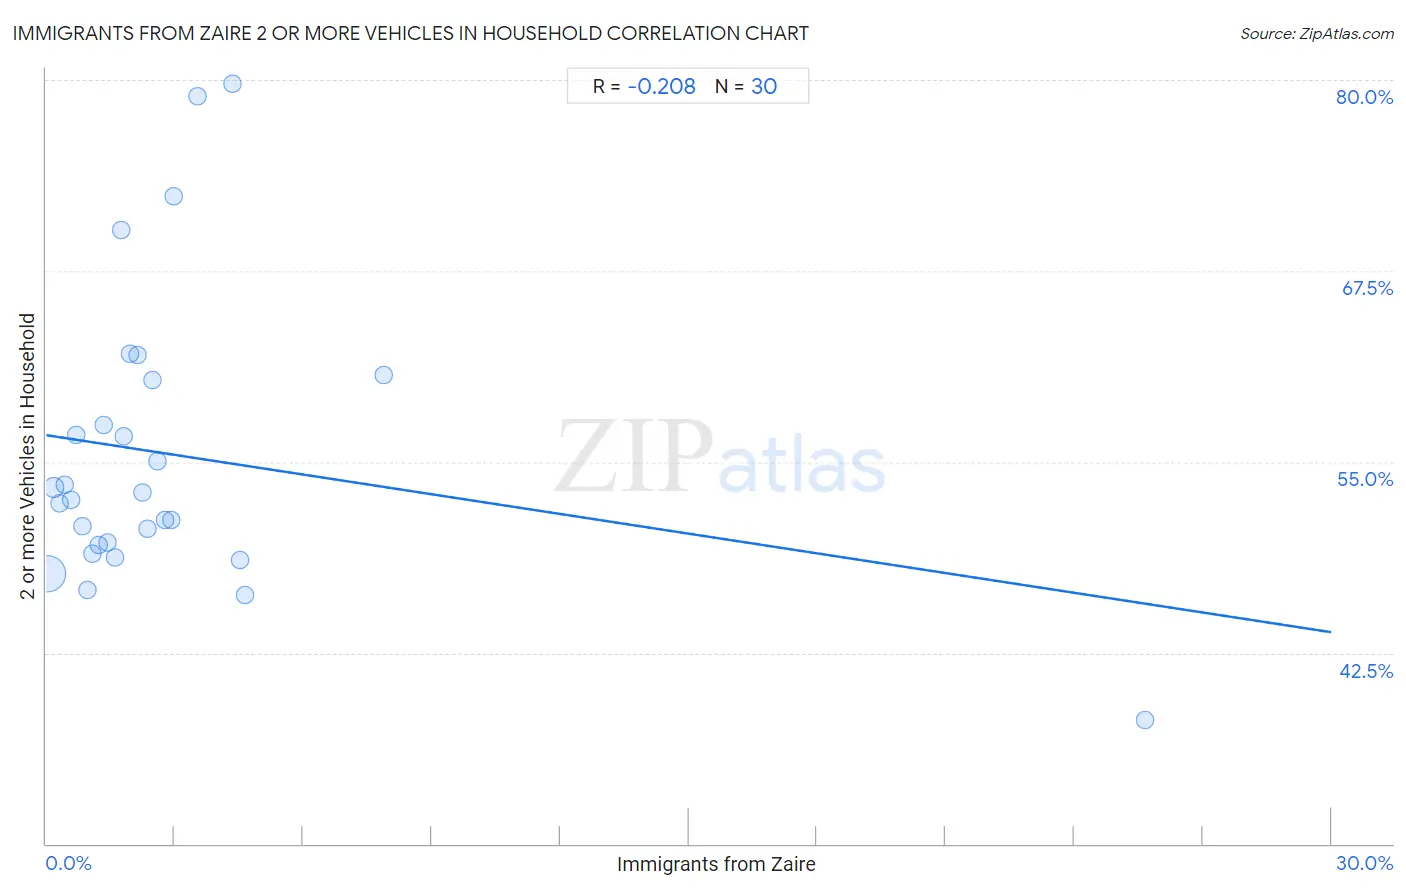
Immigrants from Zaire 2 or more Vehicles in Household Correlation Chart

The statistical analysis conducted on geographies consisting of 107,246,082 people shows a weak negative correlation between the proportion of Immigrants from Zaire and percentage of households with 2 or more vehicles available in the United States with a correlation coefficient (R) of -0.208 and weighted average of 51.5%. On average, for every 1% (one percent) increase in Immigrants from Zaire within a typical geography, there is a decrease of 0.43% in percentage of households with 2 or more vehicles available.
Immigrants from Zaire 2 or more Vehicles in Household
It is essential to understand that the correlation between the percentage of Immigrants from Zaire and percentage of households with 2 or more vehicles available does not imply a direct cause-and-effect relationship. It remains uncertain whether the presence of Immigrants from Zaire influences an upward or downward trend in the level of percentage of households with 2 or more vehicles available within an area, or if Immigrants from Zaire simply ended up residing in those areas with higher or lower levels of percentage of households with 2 or more vehicles available due to other factors.

Demographics Similar to Immigrants from Zaire by 2 or more Vehicles in Household

In terms of 2 or more vehicles in household, the demographic groups most similar to Immigrants from Zaire are Immigrants from China (51.5%, a difference of 0.040%), Bahamian (51.5%, a difference of 0.12%), Immigrants from Uruguay (51.4%, a difference of 0.16%), Immigrants from Kazakhstan (51.6%, a difference of 0.18%), and Immigrants from Liberia (51.3%, a difference of 0.30%).
DemographicsRating | Rank2 or more Vehicles in Household
Immigrants from Africa
0.2
/100
|
#277
Tragic
51.8%
Yuman
0.1
/100
|
#278
Tragic
51.7%
Liberians
0.1
/100
|
#279
Tragic
51.7%
Immigrants from Eastern Europe
0.1
/100
|
#280
Tragic
51.7%
Immigrants from Kazakhstan
0.1
/100
|
#281
Tragic
51.6%
Bahamians
0.1
/100
|
#282
Tragic
51.5%
Immigrants from China
0.1
/100
|
#283
Tragic
51.5%
Immigrants from Zaire
0.1
/100
|
#284
Tragic
51.5%
Immigrants from Uruguay
0.1
/100
|
#285
Tragic
51.4%
Immigrants from Liberia
0.1
/100
|
#286
Tragic
51.3%
Immigrants from Serbia
0.1
/100
|
#287
Tragic
51.3%
Okinawans
0.1
/100
|
#288
Tragic
51.2%
Somalis
0.0
/100
|
#289
Tragic
51.1%
Immigrants from Panama
0.0
/100
|
#290
Tragic
51.1%
Belizeans
0.0
/100
|
#291
Tragic
51.0%

Immigrants from Zaire 2 or more Vehicles in Household Correlation Summary

MeasurementImmigrants from Zaire Data2 or more Vehicles in Household Data
Minimum0.034%38.1%
Maximum25.6%79.7%
Range25.6%41.6%
Mean2.9%55.5%
Median1.9%52.7%
Interquartile 25% (IQ1)0.97%49.5%
Interquartile 75% (IQ3)2.9%60.4%
Interquartile Range (IQR)1.9%10.8%
Standard Deviation (Sample)4.6%9.5%
Standard Deviation (Population)4.5%9.4%

Correlation Details

Immigrants from Zaire PercentileSample Size2 or more Vehicles in Household
[
0.0%
-
0.5%
]
0.034%
85,966,50347.7%
[
0.0%
-
0.5%
]
0.18%
11,591,03353.3%
[
0.0%
-
0.5%
]
0.31%
3,926,07952.3%
[
0.0%
-
0.5%
]
0.44%
2,400,04853.5%
[
0.5%
-
1.0%
]
0.58%
924,93852.5%
[
0.5%
-
1.0%
]
0.69%
445,43056.7%
[
0.5%
-
1.0%
]
0.83%
452,78750.8%
[
0.5%
-
1.0%
]
0.97%
319,50946.6%
[
1.0%
-
1.5%
]
1.09%
351,58049.0%
[
1.0%
-
1.5%
]
1.24%
182,59249.5%
[
1.0%
-
1.5%
]
1.34%
152,27557.4%
[
1.0%
-
1.5%
]
1.44%
48,35549.7%
[
1.5%
-
2.0%
]
1.61%
92,43148.7%
[
1.5%
-
2.0%
]
1.74%
6,14870.1%
[
1.5%
-
2.0%
]
1.81%
22,86056.7%
[
1.5%
-
2.0%
]
1.96%
63,03562.1%
[
2.0%
-
2.5%
]
2.14%
37,92662.0%
[
2.0%
-
2.5%
]
2.26%
23,42853.0%
[
2.0%
-
2.5%
]
2.36%
36,39050.7%
[
2.0%
-
2.5%
]
2.48%
63,39460.4%
[
2.5%
-
3.0%
]
2.60%
12,36555.1%
[
2.5%
-
3.0%
]
2.76%
72451.2%
[
2.5%
-
3.0%
]
2.92%
67,13451.2%
[
2.5%
-
3.0%
]
2.98%
8,68172.4%
[
3.5%
-
4.0%
]
3.54%
4,80979.0%
[
4.0%
-
4.5%
]
4.34%
36979.7%
[
4.5%
-
5.0%
]
4.52%
43,11048.6%
[
4.5%
-
5.0%
]
4.64%
1,20846.3%
[
7.5%
-
8.0%
]
7.88%
86360.7%
[
25.5%
-
26.0%
]
25.64%
7838.1%