Immigrants from Zaire Self-Care Disability

COMPARE

Immigrants from Zaire
Race
Ancestry
AfghanAfricanAlaska NativeAlaskan AthabascanAlbanianAleutAlsatianAmericanApacheArabArapahoArgentineanArmenianAssyrian/Chaldean/SyriacAustralianAustrianBahamianBangladeshiBarbadianBasqueBelgianBelizeanBermudanBhutaneseBlackfeetBolivianBrazilianBritishBritish West IndianBulgarianBurmeseCajunCambodianCanadianCape VerdeanCarpatho RusynCelticCentral AmericanCentral American IndianCherokeeCheyenneChickasawChileanChineseChippewaChoctawColombianColvilleComancheCosta RicanCreeCreekCroatianCrowCubanCypriotCzechCzechoslovakianDanishDelawareDominicanDutchDutch West IndianEastern EuropeanEcuadorianEgyptianEnglishEstonianEthiopianEuropeanFijianFilipinoFinnishFrenchFrench American IndianFrench CanadianGermanGerman RussianGhanaianGreekGuamanian/ChamorroGuatemalanGuyaneseHaitianHmongHonduranHopiHoumaHungarianIcelanderIndian (Asian)IndonesianInupiatIranianIraqiIrishIroquoisIsraeliItalianJamaicanJapaneseJordanianKenyanKiowaKoreanLaotianLatvianLebaneseLiberianLithuanianLumbeeLuxembourgerMacedonianMalaysianMalteseMarshalleseMenomineeMexicanMexican American IndianMongolianMoroccanNative HawaiianNavajoNepaleseNew ZealanderNicaraguanNigerianNorthern EuropeanNorwegianOkinawanOsageOttawaPaiutePakistaniPalestinianPanamanianParaguayanPennsylvania GermanPeruvianPimaPolishPortuguesePotawatomiPuebloPuerto RicanPuget Sound SalishRomanianRussianSalvadoranSamoanScandinavianScotch-IrishScottishSeminoleSenegaleseSerbianShoshoneSierra LeoneanSiouxSlavicSlovakSloveneSomaliSouth AfricanSouth AmericanSouth American IndianSoviet UnionSpaniardSpanishSpanish AmericanSpanish American IndianSri LankanSubsaharan AfricanSudaneseSwedishSwissSyrianTaiwaneseThaiTlingit-HaidaTohono O'OdhamTonganTrinidadian and TobagonianTsimshianTurkishU.S. Virgin IslanderUgandanUkrainianUruguayanUteVenezuelanVietnameseWelshWest IndianYakamaYaquiYugoslavianYumanYup'ikZimbabwean
Immigration
NonimmigrantsImmigrantsAfghanistanAfricaAlbaniaArgentinaArmeniaAsiaAustraliaAustriaBahamasBangladeshBarbadosBelarusBelgiumBelizeBoliviaBosnia and HerzegovinaBrazilBulgariaBurma/MyanmarCabo VerdeCambodiaCameroonCanadaCaribbeanCentral AmericaChileChinaColombiaCongoCosta RicaCroatiaCubaCzechoslovakiaDenmarkDominicaDominican RepublicEastern AfricaEastern AsiaEastern EuropeEcuadorEgyptEl SalvadorEnglandEritreaEthiopiaEuropeFijiFranceGermanyGhanaGreeceGrenadaGuatemalaGuyanaHaitiHondurasHong KongHungaryIndiaIndonesiaIranIraqIrelandIsraelItalyJamaicaJapanJordanKazakhstanKenyaKoreaKuwaitLaosLatin AmericaLatviaLebanonLiberiaLithuaniaMalaysiaMexicoMicronesiaMiddle AfricaMoldovaMoroccoNepalNetherlandsNicaraguaNigeriaNorth AmericaNorth MacedoniaNorthern AfricaNorthern EuropeNorwayOceaniaPakistanPanamaPeruPhilippinesPolandPortugalRomaniaRussiaSaudi ArabiaScotlandSenegalSerbiaSierra LeoneSingaporeSomaliaSouth AfricaSouth AmericaSouth Central AsiaSouth Eastern AsiaSouthern EuropeSpainSri LankaSt. Vincent and the GrenadinesSudanSwedenSwitzerlandSyriaTaiwanThailandTrinidad and TobagoTurkeyUgandaUkraineUruguayUzbekistanVenezuelaVietnamWest IndiesWestern AfricaWestern AsiaWestern EuropeYemenZaireZimbabweAzores
Select to Compare
Race
Ancestry
AfghanAfricanAlaska NativeAlaskan AthabascanAlbanianAleutAlsatianAmericanApacheArabArapahoArgentineanArmenianAssyrian/Chaldean/SyriacAustralianAustrianBahamianBangladeshiBarbadianBasqueBelgianBelizeanBermudanBhutaneseBlackfeetBolivianBrazilianBritishBritish West IndianBulgarianBurmeseCajunCambodianCanadianCape VerdeanCarpatho RusynCelticCentral AmericanCentral American IndianCherokeeCheyenneChickasawChileanChineseChippewaChoctawColombianColvilleComancheCosta RicanCreeCreekCroatianCrowCubanCypriotCzechCzechoslovakianDanishDelawareDominicanDutchDutch West IndianEastern EuropeanEcuadorianEgyptianEnglishEstonianEthiopianEuropeanFijianFilipinoFinnishFrenchFrench American IndianFrench CanadianGermanGerman RussianGhanaianGreekGuamanian/ChamorroGuatemalanGuyaneseHaitianHmongHonduranHopiHoumaHungarianIcelanderIndian (Asian)IndonesianInupiatIranianIraqiIrishIroquoisIsraeliItalianJamaicanJapaneseJordanianKenyanKiowaKoreanLaotianLatvianLebaneseLiberianLithuanianLumbeeLuxembourgerMacedonianMalaysianMalteseMarshalleseMenomineeMexicanMexican American IndianMongolianMoroccanNative HawaiianNavajoNepaleseNew ZealanderNicaraguanNigerianNorthern EuropeanNorwegianOkinawanOsageOttawaPaiutePakistaniPalestinianPanamanianParaguayanPennsylvania GermanPeruvianPimaPolishPortuguesePotawatomiPuebloPuerto RicanPuget Sound SalishRomanianRussianSalvadoranSamoanScandinavianScotch-IrishScottishSeminoleSenegaleseSerbianShoshoneSierra LeoneanSiouxSlavicSlovakSloveneSomaliSouth AfricanSouth AmericanSouth American IndianSoviet UnionSpaniardSpanishSpanish AmericanSpanish American IndianSri LankanSubsaharan AfricanSudaneseSwedishSwissSyrianTaiwaneseThaiTlingit-HaidaTohono O'OdhamTonganTrinidadian and TobagonianTsimshianTurkishU.S. Virgin IslanderUgandanUkrainianUruguayanUteVenezuelanVietnameseWelshWest IndianYakamaYaquiYugoslavianYumanYup'ikZimbabwean
Immigration
NonimmigrantsImmigrantsAfghanistanAfricaAlbaniaArgentinaArmeniaAsiaAustraliaAustriaBahamasBangladeshBarbadosBelarusBelgiumBelizeBoliviaBosnia and HerzegovinaBrazilBulgariaBurma/MyanmarCabo VerdeCambodiaCameroonCanadaCaribbeanCentral AmericaChileChinaColombiaCongoCosta RicaCroatiaCubaCzechoslovakiaDenmarkDominicaDominican RepublicEastern AfricaEastern AsiaEastern EuropeEcuadorEgyptEl SalvadorEnglandEritreaEthiopiaEuropeFijiFranceGermanyGhanaGreeceGrenadaGuatemalaGuyanaHaitiHondurasHong KongHungaryIndiaIndonesiaIranIraqIrelandIsraelItalyJamaicaJapanJordanKazakhstanKenyaKoreaKuwaitLaosLatin AmericaLatviaLebanonLiberiaLithuaniaMalaysiaMexicoMicronesiaMiddle AfricaMoldovaMoroccoNepalNetherlandsNicaraguaNigeriaNorth AmericaNorth MacedoniaNorthern AfricaNorthern EuropeNorwayOceaniaPakistanPanamaPeruPhilippinesPolandPortugalRomaniaRussiaSaudi ArabiaScotlandSenegalSerbiaSierra LeoneSingaporeSomaliaSouth AfricaSouth AmericaSouth Central AsiaSouth Eastern AsiaSouthern EuropeSpainSri LankaSt. Vincent and the GrenadinesSudanSwedenSwitzerlandSyriaTaiwanThailandTrinidad and TobagoTurkeyUgandaUkraineUruguayUzbekistanVenezuelaVietnamWest IndiesWestern AfricaWestern AsiaWestern EuropeYemenZimbabweAzores
Self-Care Disability
Income
Poverty
Unemployment
Labor Participation
Family Structure
Vehicle Availability
Education Level
Disability

Immigrants from Zaire Self-Care Disability
Exceptional

2.3%
SELF-CARE DISABILITY
99.2/ 100
METRIC RATING
68th/ 347
METRIC RANK

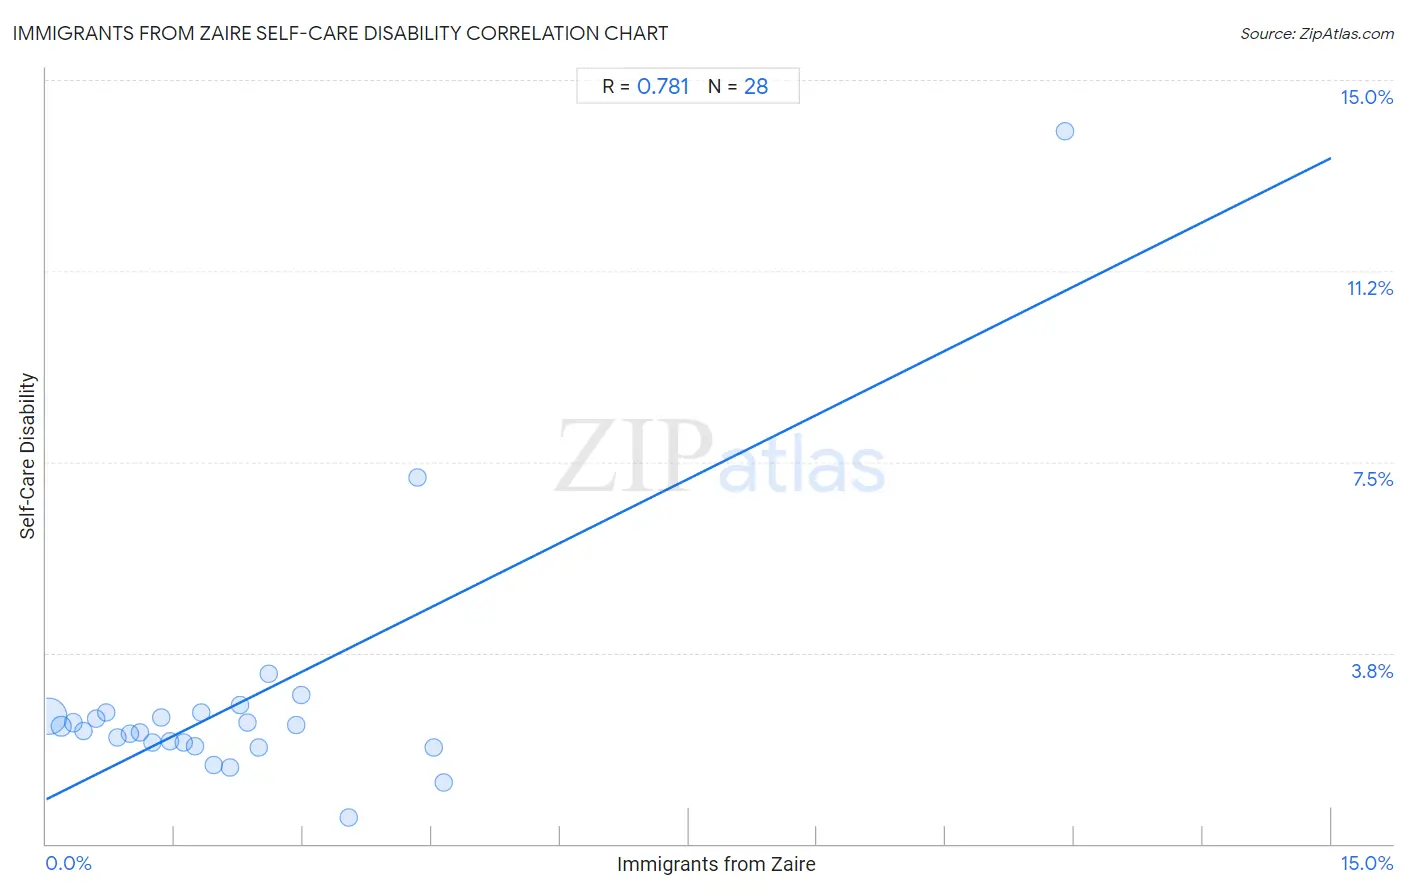
Immigrants from Zaire Self-Care Disability Correlation Chart

The statistical analysis conducted on geographies consisting of 107,230,784 people shows a strong positive correlation between the proportion of Immigrants from Zaire and percentage of population with self-care disability in the United States with a correlation coefficient (R) of 0.781 and weighted average of 2.3%. On average, for every 1% (one percent) increase in Immigrants from Zaire within a typical geography, there is an increase of 0.84% in percentage of population with self-care disability.
Immigrants from Zaire Self-Care Disability
It is essential to understand that the correlation between the percentage of Immigrants from Zaire and percentage of population with self-care disability does not imply a direct cause-and-effect relationship. It remains uncertain whether the presence of Immigrants from Zaire influences an upward or downward trend in the level of percentage of population with self-care disability within an area, or if Immigrants from Zaire simply ended up residing in those areas with higher or lower levels of percentage of population with self-care disability due to other factors.

Demographics Similar to Immigrants from Zaire by Self-Care Disability

In terms of self-care disability, the demographic groups most similar to Immigrants from Zaire are Immigrants from Norway (2.3%, a difference of 0.0%), Immigrants from Northern Europe (2.3%, a difference of 0.040%), Asian (2.3%, a difference of 0.070%), South African (2.3%, a difference of 0.090%), and Eastern European (2.3%, a difference of 0.10%).
DemographicsRating | RankSelf-Care Disability
Palestinians
99.4
/100
|
#61
Exceptional
2.3%
Egyptians
99.4
/100
|
#62
Exceptional
2.3%
Mongolians
99.3
/100
|
#63
Exceptional
2.3%
Swedes
99.3
/100
|
#64
Exceptional
2.3%
Brazilians
99.3
/100
|
#65
Exceptional
2.3%
Immigrants from Argentina
99.3
/100
|
#66
Exceptional
2.3%
South Africans
99.3
/100
|
#67
Exceptional
2.3%
Immigrants from Zaire
99.2
/100
|
#68
Exceptional
2.3%
Immigrants from Norway
99.2
/100
|
#69
Exceptional
2.3%
Immigrants from Northern Europe
99.2
/100
|
#70
Exceptional
2.3%
Asians
99.2
/100
|
#71
Exceptional
2.3%
Eastern Europeans
99.2
/100
|
#72
Exceptional
2.3%
Immigrants from Egypt
99.1
/100
|
#73
Exceptional
2.3%
Immigrants from Switzerland
99.1
/100
|
#74
Exceptional
2.3%
Immigrants from Netherlands
99.1
/100
|
#75
Exceptional
2.3%

Immigrants from Zaire Self-Care Disability Correlation Summary

MeasurementImmigrants from Zaire DataSelf-Care Disability Data
Minimum0.034%0.51%
Maximum11.9%14.0%
Range11.9%13.5%
Mean2.2%2.8%
Median1.8%2.3%
Interquartile 25% (IQ1)0.90%1.9%
Interquartile 75% (IQ3)2.8%2.5%
Interquartile Range (IQR)1.9%0.59%
Standard Deviation (Sample)2.3%2.5%
Standard Deviation (Population)2.2%2.4%

Correlation Details

Immigrants from Zaire PercentileSample SizeSelf-Care Disability
[
0.0%
-
0.5%
]
0.034%
85,963,9702.5%
[
0.0%
-
0.5%
]
0.18%
11,587,3872.3%
[
0.0%
-
0.5%
]
0.31%
3,921,5812.4%
[
0.0%
-
0.5%
]
0.44%
2,398,0022.2%
[
0.5%
-
1.0%
]
0.58%
924,9382.4%
[
0.5%
-
1.0%
]
0.69%
445,4302.6%
[
0.5%
-
1.0%
]
0.83%
452,7872.1%
[
0.5%
-
1.0%
]
0.97%
319,5092.2%
[
1.0%
-
1.5%
]
1.09%
351,5802.2%
[
1.0%
-
1.5%
]
1.24%
182,5922.0%
[
1.0%
-
1.5%
]
1.34%
152,2752.5%
[
1.0%
-
1.5%
]
1.44%
47,3022.0%
[
1.5%
-
2.0%
]
1.61%
92,4312.0%
[
1.5%
-
2.0%
]
1.74%
6,1481.9%
[
1.5%
-
2.0%
]
1.81%
22,8602.6%
[
1.5%
-
2.0%
]
1.96%
63,0351.5%
[
2.0%
-
2.5%
]
2.14%
37,9261.5%
[
2.0%
-
2.5%
]
2.26%
23,4282.7%
[
2.0%
-
2.5%
]
2.36%
36,3902.4%
[
2.0%
-
2.5%
]
2.48%
63,3941.9%
[
2.5%
-
3.0%
]
2.60%
12,3653.3%
[
2.5%
-
3.0%
]
2.92%
67,1342.3%
[
2.5%
-
3.0%
]
2.98%
8,6812.9%
[
3.5%
-
4.0%
]
3.54%
4,8090.51%
[
4.0%
-
4.5%
]
4.34%
3697.2%
[
4.5%
-
5.0%
]
4.52%
43,1101.9%
[
4.5%
-
5.0%
]
4.64%
1,2081.2%
[
11.5%
-
12.0%
]
11.89%
14314.0%