Immigrants from Zaire 3 or more Vehicles in Household

COMPARE

Immigrants from Zaire
Race
Ancestry
AfghanAfricanAlaska NativeAlaskan AthabascanAlbanianAleutAlsatianAmericanApacheArabArapahoArgentineanArmenianAssyrian/Chaldean/SyriacAustralianAustrianBahamianBangladeshiBarbadianBasqueBelgianBelizeanBermudanBhutaneseBlackfeetBolivianBrazilianBritishBritish West IndianBulgarianBurmeseCajunCambodianCanadianCape VerdeanCarpatho RusynCelticCentral AmericanCentral American IndianCherokeeCheyenneChickasawChileanChineseChippewaChoctawColombianColvilleComancheCosta RicanCreeCreekCroatianCrowCubanCypriotCzechCzechoslovakianDanishDelawareDominicanDutchDutch West IndianEastern EuropeanEcuadorianEgyptianEnglishEstonianEthiopianEuropeanFijianFilipinoFinnishFrenchFrench American IndianFrench CanadianGermanGerman RussianGhanaianGreekGuamanian/ChamorroGuatemalanGuyaneseHaitianHmongHonduranHopiHoumaHungarianIcelanderIndian (Asian)IndonesianInupiatIranianIraqiIrishIroquoisIsraeliItalianJamaicanJapaneseJordanianKenyanKiowaKoreanLaotianLatvianLebaneseLiberianLithuanianLumbeeLuxembourgerMacedonianMalaysianMalteseMarshalleseMenomineeMexicanMexican American IndianMongolianMoroccanNative HawaiianNavajoNepaleseNew ZealanderNicaraguanNigerianNorthern EuropeanNorwegianOkinawanOsageOttawaPaiutePakistaniPalestinianPanamanianParaguayanPennsylvania GermanPeruvianPimaPolishPortuguesePotawatomiPuebloPuerto RicanPuget Sound SalishRomanianRussianSalvadoranSamoanScandinavianScotch-IrishScottishSeminoleSenegaleseSerbianShoshoneSierra LeoneanSiouxSlavicSlovakSloveneSomaliSouth AfricanSouth AmericanSouth American IndianSoviet UnionSpaniardSpanishSpanish AmericanSpanish American IndianSri LankanSubsaharan AfricanSudaneseSwedishSwissSyrianTaiwaneseThaiTlingit-HaidaTohono O'OdhamTonganTrinidadian and TobagonianTsimshianTurkishU.S. Virgin IslanderUgandanUkrainianUruguayanUteVenezuelanVietnameseWelshWest IndianYakamaYaquiYugoslavianYumanYup'ikZimbabwean
Immigration
NonimmigrantsImmigrantsAfghanistanAfricaAlbaniaArgentinaArmeniaAsiaAustraliaAustriaBahamasBangladeshBarbadosBelarusBelgiumBelizeBoliviaBosnia and HerzegovinaBrazilBulgariaBurma/MyanmarCabo VerdeCambodiaCameroonCanadaCaribbeanCentral AmericaChileChinaColombiaCongoCosta RicaCroatiaCubaCzechoslovakiaDenmarkDominicaDominican RepublicEastern AfricaEastern AsiaEastern EuropeEcuadorEgyptEl SalvadorEnglandEritreaEthiopiaEuropeFijiFranceGermanyGhanaGreeceGrenadaGuatemalaGuyanaHaitiHondurasHong KongHungaryIndiaIndonesiaIranIraqIrelandIsraelItalyJamaicaJapanJordanKazakhstanKenyaKoreaKuwaitLaosLatin AmericaLatviaLebanonLiberiaLithuaniaMalaysiaMexicoMicronesiaMiddle AfricaMoldovaMoroccoNepalNetherlandsNicaraguaNigeriaNorth AmericaNorth MacedoniaNorthern AfricaNorthern EuropeNorwayOceaniaPakistanPanamaPeruPhilippinesPolandPortugalRomaniaRussiaSaudi ArabiaScotlandSenegalSerbiaSierra LeoneSingaporeSomaliaSouth AfricaSouth AmericaSouth Central AsiaSouth Eastern AsiaSouthern EuropeSpainSri LankaSt. Vincent and the GrenadinesSudanSwedenSwitzerlandSyriaTaiwanThailandTrinidad and TobagoTurkeyUgandaUkraineUruguayUzbekistanVenezuelaVietnamWest IndiesWestern AfricaWestern AsiaWestern EuropeYemenZaireZimbabweAzores
Select to Compare
Race
Ancestry
AfghanAfricanAlaska NativeAlaskan AthabascanAlbanianAleutAlsatianAmericanApacheArabArapahoArgentineanArmenianAssyrian/Chaldean/SyriacAustralianAustrianBahamianBangladeshiBarbadianBasqueBelgianBelizeanBermudanBhutaneseBlackfeetBolivianBrazilianBritishBritish West IndianBulgarianBurmeseCajunCambodianCanadianCape VerdeanCarpatho RusynCelticCentral AmericanCentral American IndianCherokeeCheyenneChickasawChileanChineseChippewaChoctawColombianColvilleComancheCosta RicanCreeCreekCroatianCrowCubanCypriotCzechCzechoslovakianDanishDelawareDominicanDutchDutch West IndianEastern EuropeanEcuadorianEgyptianEnglishEstonianEthiopianEuropeanFijianFilipinoFinnishFrenchFrench American IndianFrench CanadianGermanGerman RussianGhanaianGreekGuamanian/ChamorroGuatemalanGuyaneseHaitianHmongHonduranHopiHoumaHungarianIcelanderIndian (Asian)IndonesianInupiatIranianIraqiIrishIroquoisIsraeliItalianJamaicanJapaneseJordanianKenyanKiowaKoreanLaotianLatvianLebaneseLiberianLithuanianLumbeeLuxembourgerMacedonianMalaysianMalteseMarshalleseMenomineeMexicanMexican American IndianMongolianMoroccanNative HawaiianNavajoNepaleseNew ZealanderNicaraguanNigerianNorthern EuropeanNorwegianOkinawanOsageOttawaPaiutePakistaniPalestinianPanamanianParaguayanPennsylvania GermanPeruvianPimaPolishPortuguesePotawatomiPuebloPuerto RicanPuget Sound SalishRomanianRussianSalvadoranSamoanScandinavianScotch-IrishScottishSeminoleSenegaleseSerbianShoshoneSierra LeoneanSiouxSlavicSlovakSloveneSomaliSouth AfricanSouth AmericanSouth American IndianSoviet UnionSpaniardSpanishSpanish AmericanSpanish American IndianSri LankanSubsaharan AfricanSudaneseSwedishSwissSyrianTaiwaneseThaiTlingit-HaidaTohono O'OdhamTonganTrinidadian and TobagonianTsimshianTurkishU.S. Virgin IslanderUgandanUkrainianUruguayanUteVenezuelanVietnameseWelshWest IndianYakamaYaquiYugoslavianYumanYup'ikZimbabwean
Immigration
NonimmigrantsImmigrantsAfghanistanAfricaAlbaniaArgentinaArmeniaAsiaAustraliaAustriaBahamasBangladeshBarbadosBelarusBelgiumBelizeBoliviaBosnia and HerzegovinaBrazilBulgariaBurma/MyanmarCabo VerdeCambodiaCameroonCanadaCaribbeanCentral AmericaChileChinaColombiaCongoCosta RicaCroatiaCubaCzechoslovakiaDenmarkDominicaDominican RepublicEastern AfricaEastern AsiaEastern EuropeEcuadorEgyptEl SalvadorEnglandEritreaEthiopiaEuropeFijiFranceGermanyGhanaGreeceGrenadaGuatemalaGuyanaHaitiHondurasHong KongHungaryIndiaIndonesiaIranIraqIrelandIsraelItalyJamaicaJapanJordanKazakhstanKenyaKoreaKuwaitLaosLatin AmericaLatviaLebanonLiberiaLithuaniaMalaysiaMexicoMicronesiaMiddle AfricaMoldovaMoroccoNepalNetherlandsNicaraguaNigeriaNorth AmericaNorth MacedoniaNorthern AfricaNorthern EuropeNorwayOceaniaPakistanPanamaPeruPhilippinesPolandPortugalRomaniaRussiaSaudi ArabiaScotlandSenegalSerbiaSierra LeoneSingaporeSomaliaSouth AfricaSouth AmericaSouth Central AsiaSouth Eastern AsiaSouthern EuropeSpainSri LankaSt. Vincent and the GrenadinesSudanSwedenSwitzerlandSyriaTaiwanThailandTrinidad and TobagoTurkeyUgandaUkraineUruguayUzbekistanVenezuelaVietnamWest IndiesWestern AfricaWestern AsiaWestern EuropeYemenZimbabweAzores
3 or more Vehicles in Household
Income
Poverty
Unemployment
Labor Participation
Family Structure
Vehicle Availability
Education Level
Disability

Immigrants from Zaire 3 or more Vehicles in Household
Tragic

16.7%
3+ VEHICLES AVAILABLE
0.1/ 100
METRIC RATING
298th/ 347
METRIC RANK

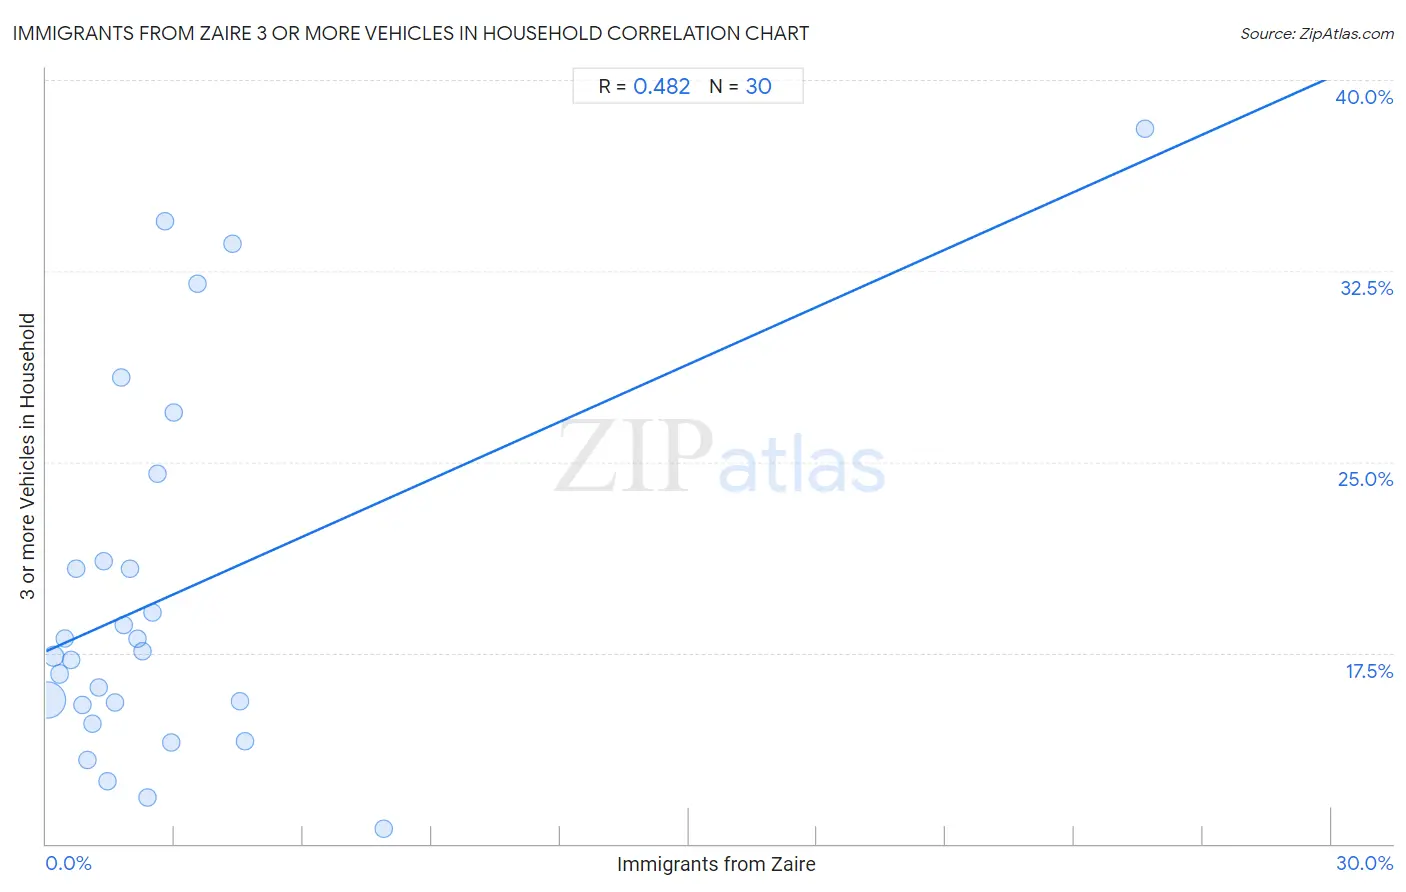
Immigrants from Zaire 3 or more Vehicles in Household Correlation Chart

The statistical analysis conducted on geographies consisting of 107,239,583 people shows a moderate positive correlation between the proportion of Immigrants from Zaire and percentage of households with 3 or more vehicles available in the United States with a correlation coefficient (R) of 0.482 and weighted average of 16.7%. On average, for every 1% (one percent) increase in Immigrants from Zaire within a typical geography, there is an increase of 0.75% in percentage of households with 3 or more vehicles available.
Immigrants from Zaire 3 or more Vehicles in Household
It is essential to understand that the correlation between the percentage of Immigrants from Zaire and percentage of households with 3 or more vehicles available does not imply a direct cause-and-effect relationship. It remains uncertain whether the presence of Immigrants from Zaire influences an upward or downward trend in the level of percentage of households with 3 or more vehicles available within an area, or if Immigrants from Zaire simply ended up residing in those areas with higher or lower levels of percentage of households with 3 or more vehicles available due to other factors.

Demographics Similar to Immigrants from Zaire by 3 or more Vehicles in Household

In terms of 3 or more vehicles in household, the demographic groups most similar to Immigrants from Zaire are Immigrants from South America (16.7%, a difference of 0.060%), Israeli (16.8%, a difference of 0.37%), Cypriot (16.6%, a difference of 0.54%), Inupiat (16.9%, a difference of 0.84%), and Paraguayan (16.6%, a difference of 0.95%).
DemographicsRating | Rank3 or more Vehicles in Household
Immigrants from Congo
0.1
/100
|
#291
Tragic
17.0%
Immigrants from Spain
0.1
/100
|
#292
Tragic
17.0%
Bahamians
0.1
/100
|
#293
Tragic
16.9%
Immigrants from Western Africa
0.1
/100
|
#294
Tragic
16.9%
Immigrants from Russia
0.1
/100
|
#295
Tragic
16.9%
Inupiat
0.1
/100
|
#296
Tragic
16.9%
Israelis
0.1
/100
|
#297
Tragic
16.8%
Immigrants from Zaire
0.1
/100
|
#298
Tragic
16.7%
Immigrants from South America
0.1
/100
|
#299
Tragic
16.7%
Cypriots
0.0
/100
|
#300
Tragic
16.6%
Paraguayans
0.0
/100
|
#301
Tragic
16.6%
Immigrants from Greece
0.0
/100
|
#302
Tragic
16.5%
Immigrants from Serbia
0.0
/100
|
#303
Tragic
16.4%
Ghanaians
0.0
/100
|
#304
Tragic
16.4%
Immigrants from Morocco
0.0
/100
|
#305
Tragic
16.3%

Immigrants from Zaire 3 or more Vehicles in Household Correlation Summary

MeasurementImmigrants from Zaire Data3 or more Vehicles in Household Data
Minimum0.034%10.6%
Maximum25.6%38.1%
Range25.6%27.5%
Mean2.9%19.8%
Median1.9%17.5%
Interquartile 25% (IQ1)0.97%15.4%
Interquartile 75% (IQ3)2.9%21.1%
Interquartile Range (IQR)1.9%5.7%
Standard Deviation (Sample)4.6%7.2%
Standard Deviation (Population)4.5%7.1%

Correlation Details

Immigrants from Zaire PercentileSample Size3 or more Vehicles in Household
[
0.0%
-
0.5%
]
0.034%
85,963,97015.6%
[
0.0%
-
0.5%
]
0.18%
11,591,03317.4%
[
0.0%
-
0.5%
]
0.31%
3,926,07916.7%
[
0.0%
-
0.5%
]
0.44%
2,400,04818.1%
[
0.5%
-
1.0%
]
0.58%
920,97217.2%
[
0.5%
-
1.0%
]
0.69%
445,43020.8%
[
0.5%
-
1.0%
]
0.83%
452,78715.4%
[
0.5%
-
1.0%
]
0.97%
319,50913.3%
[
1.0%
-
1.5%
]
1.09%
351,58014.7%
[
1.0%
-
1.5%
]
1.24%
182,59216.2%
[
1.0%
-
1.5%
]
1.34%
152,27521.1%
[
1.0%
-
1.5%
]
1.44%
48,35512.5%
[
1.5%
-
2.0%
]
1.61%
92,43115.6%
[
1.5%
-
2.0%
]
1.74%
6,14828.3%
[
1.5%
-
2.0%
]
1.81%
22,86018.6%
[
1.5%
-
2.0%
]
1.96%
63,03520.8%
[
2.0%
-
2.5%
]
2.14%
37,92618.0%
[
2.0%
-
2.5%
]
2.26%
23,42817.5%
[
2.0%
-
2.5%
]
2.36%
36,39011.8%
[
2.0%
-
2.5%
]
2.48%
63,39419.1%
[
2.5%
-
3.0%
]
2.60%
12,36524.6%
[
2.5%
-
3.0%
]
2.76%
72434.5%
[
2.5%
-
3.0%
]
2.92%
67,13414.0%
[
2.5%
-
3.0%
]
2.98%
8,68126.9%
[
3.5%
-
4.0%
]
3.54%
4,80932.0%
[
4.0%
-
4.5%
]
4.34%
36933.6%
[
4.5%
-
5.0%
]
4.52%
43,11015.6%
[
4.5%
-
5.0%
]
4.64%
1,20814.0%
[
7.5%
-
8.0%
]
7.88%
86310.6%
[
25.5%
-
26.0%
]
25.64%
7838.1%