Immigrants from Zaire GED/Equivalency

COMPARE

Immigrants from Zaire
Race
Ancestry
AfghanAfricanAlaska NativeAlaskan AthabascanAlbanianAleutAlsatianAmericanApacheArabArapahoArgentineanArmenianAssyrian/Chaldean/SyriacAustralianAustrianBahamianBangladeshiBarbadianBasqueBelgianBelizeanBermudanBhutaneseBlackfeetBolivianBrazilianBritishBritish West IndianBulgarianBurmeseCajunCambodianCanadianCape VerdeanCarpatho RusynCelticCentral AmericanCentral American IndianCherokeeCheyenneChickasawChileanChineseChippewaChoctawColombianColvilleComancheCosta RicanCreeCreekCroatianCrowCubanCypriotCzechCzechoslovakianDanishDelawareDominicanDutchDutch West IndianEastern EuropeanEcuadorianEgyptianEnglishEstonianEthiopianEuropeanFijianFilipinoFinnishFrenchFrench American IndianFrench CanadianGermanGerman RussianGhanaianGreekGuamanian/ChamorroGuatemalanGuyaneseHaitianHmongHonduranHopiHoumaHungarianIcelanderIndian (Asian)IndonesianInupiatIranianIraqiIrishIroquoisIsraeliItalianJamaicanJapaneseJordanianKenyanKiowaKoreanLaotianLatvianLebaneseLiberianLithuanianLumbeeLuxembourgerMacedonianMalaysianMalteseMarshalleseMenomineeMexicanMexican American IndianMongolianMoroccanNative HawaiianNavajoNepaleseNew ZealanderNicaraguanNigerianNorthern EuropeanNorwegianOkinawanOsageOttawaPaiutePakistaniPalestinianPanamanianParaguayanPennsylvania GermanPeruvianPimaPolishPortuguesePotawatomiPuebloPuerto RicanPuget Sound SalishRomanianRussianSalvadoranSamoanScandinavianScotch-IrishScottishSeminoleSenegaleseSerbianShoshoneSierra LeoneanSiouxSlavicSlovakSloveneSomaliSouth AfricanSouth AmericanSouth American IndianSoviet UnionSpaniardSpanishSpanish AmericanSpanish American IndianSri LankanSubsaharan AfricanSudaneseSwedishSwissSyrianTaiwaneseThaiTlingit-HaidaTohono O'OdhamTonganTrinidadian and TobagonianTsimshianTurkishU.S. Virgin IslanderUgandanUkrainianUruguayanUteVenezuelanVietnameseWelshWest IndianYakamaYaquiYugoslavianYumanYup'ikZimbabwean
Immigration
NonimmigrantsImmigrantsAfghanistanAfricaAlbaniaArgentinaArmeniaAsiaAustraliaAustriaBahamasBangladeshBarbadosBelarusBelgiumBelizeBoliviaBosnia and HerzegovinaBrazilBulgariaBurma/MyanmarCabo VerdeCambodiaCameroonCanadaCaribbeanCentral AmericaChileChinaColombiaCongoCosta RicaCroatiaCubaCzechoslovakiaDenmarkDominicaDominican RepublicEastern AfricaEastern AsiaEastern EuropeEcuadorEgyptEl SalvadorEnglandEritreaEthiopiaEuropeFijiFranceGermanyGhanaGreeceGrenadaGuatemalaGuyanaHaitiHondurasHong KongHungaryIndiaIndonesiaIranIraqIrelandIsraelItalyJamaicaJapanJordanKazakhstanKenyaKoreaKuwaitLaosLatin AmericaLatviaLebanonLiberiaLithuaniaMalaysiaMexicoMicronesiaMiddle AfricaMoldovaMoroccoNepalNetherlandsNicaraguaNigeriaNorth AmericaNorth MacedoniaNorthern AfricaNorthern EuropeNorwayOceaniaPakistanPanamaPeruPhilippinesPolandPortugalRomaniaRussiaSaudi ArabiaScotlandSenegalSerbiaSierra LeoneSingaporeSomaliaSouth AfricaSouth AmericaSouth Central AsiaSouth Eastern AsiaSouthern EuropeSpainSri LankaSt. Vincent and the GrenadinesSudanSwedenSwitzerlandSyriaTaiwanThailandTrinidad and TobagoTurkeyUgandaUkraineUruguayUzbekistanVenezuelaVietnamWest IndiesWestern AfricaWestern AsiaWestern EuropeYemenZaireZimbabweAzores
Select to Compare
Race
Ancestry
AfghanAfricanAlaska NativeAlaskan AthabascanAlbanianAleutAlsatianAmericanApacheArabArapahoArgentineanArmenianAssyrian/Chaldean/SyriacAustralianAustrianBahamianBangladeshiBarbadianBasqueBelgianBelizeanBermudanBhutaneseBlackfeetBolivianBrazilianBritishBritish West IndianBulgarianBurmeseCajunCambodianCanadianCape VerdeanCarpatho RusynCelticCentral AmericanCentral American IndianCherokeeCheyenneChickasawChileanChineseChippewaChoctawColombianColvilleComancheCosta RicanCreeCreekCroatianCrowCubanCypriotCzechCzechoslovakianDanishDelawareDominicanDutchDutch West IndianEastern EuropeanEcuadorianEgyptianEnglishEstonianEthiopianEuropeanFijianFilipinoFinnishFrenchFrench American IndianFrench CanadianGermanGerman RussianGhanaianGreekGuamanian/ChamorroGuatemalanGuyaneseHaitianHmongHonduranHopiHoumaHungarianIcelanderIndian (Asian)IndonesianInupiatIranianIraqiIrishIroquoisIsraeliItalianJamaicanJapaneseJordanianKenyanKiowaKoreanLaotianLatvianLebaneseLiberianLithuanianLumbeeLuxembourgerMacedonianMalaysianMalteseMarshalleseMenomineeMexicanMexican American IndianMongolianMoroccanNative HawaiianNavajoNepaleseNew ZealanderNicaraguanNigerianNorthern EuropeanNorwegianOkinawanOsageOttawaPaiutePakistaniPalestinianPanamanianParaguayanPennsylvania GermanPeruvianPimaPolishPortuguesePotawatomiPuebloPuerto RicanPuget Sound SalishRomanianRussianSalvadoranSamoanScandinavianScotch-IrishScottishSeminoleSenegaleseSerbianShoshoneSierra LeoneanSiouxSlavicSlovakSloveneSomaliSouth AfricanSouth AmericanSouth American IndianSoviet UnionSpaniardSpanishSpanish AmericanSpanish American IndianSri LankanSubsaharan AfricanSudaneseSwedishSwissSyrianTaiwaneseThaiTlingit-HaidaTohono O'OdhamTonganTrinidadian and TobagonianTsimshianTurkishU.S. Virgin IslanderUgandanUkrainianUruguayanUteVenezuelanVietnameseWelshWest IndianYakamaYaquiYugoslavianYumanYup'ikZimbabwean
Immigration
NonimmigrantsImmigrantsAfghanistanAfricaAlbaniaArgentinaArmeniaAsiaAustraliaAustriaBahamasBangladeshBarbadosBelarusBelgiumBelizeBoliviaBosnia and HerzegovinaBrazilBulgariaBurma/MyanmarCabo VerdeCambodiaCameroonCanadaCaribbeanCentral AmericaChileChinaColombiaCongoCosta RicaCroatiaCubaCzechoslovakiaDenmarkDominicaDominican RepublicEastern AfricaEastern AsiaEastern EuropeEcuadorEgyptEl SalvadorEnglandEritreaEthiopiaEuropeFijiFranceGermanyGhanaGreeceGrenadaGuatemalaGuyanaHaitiHondurasHong KongHungaryIndiaIndonesiaIranIraqIrelandIsraelItalyJamaicaJapanJordanKazakhstanKenyaKoreaKuwaitLaosLatin AmericaLatviaLebanonLiberiaLithuaniaMalaysiaMexicoMicronesiaMiddle AfricaMoldovaMoroccoNepalNetherlandsNicaraguaNigeriaNorth AmericaNorth MacedoniaNorthern AfricaNorthern EuropeNorwayOceaniaPakistanPanamaPeruPhilippinesPolandPortugalRomaniaRussiaSaudi ArabiaScotlandSenegalSerbiaSierra LeoneSingaporeSomaliaSouth AfricaSouth AmericaSouth Central AsiaSouth Eastern AsiaSouthern EuropeSpainSri LankaSt. Vincent and the GrenadinesSudanSwedenSwitzerlandSyriaTaiwanThailandTrinidad and TobagoTurkeyUgandaUkraineUruguayUzbekistanVenezuelaVietnamWest IndiesWestern AfricaWestern AsiaWestern EuropeYemenZimbabweAzores
GED/Equivalency
Income
Poverty
Unemployment
Labor Participation
Family Structure
Vehicle Availability
Education Level
Disability

Immigrants from Zaire GED/Equivalency
Tragic

84.5%
GED/EQUIVALENCY
5.5/ 100
METRIC RATING
226th/ 347
METRIC RANK

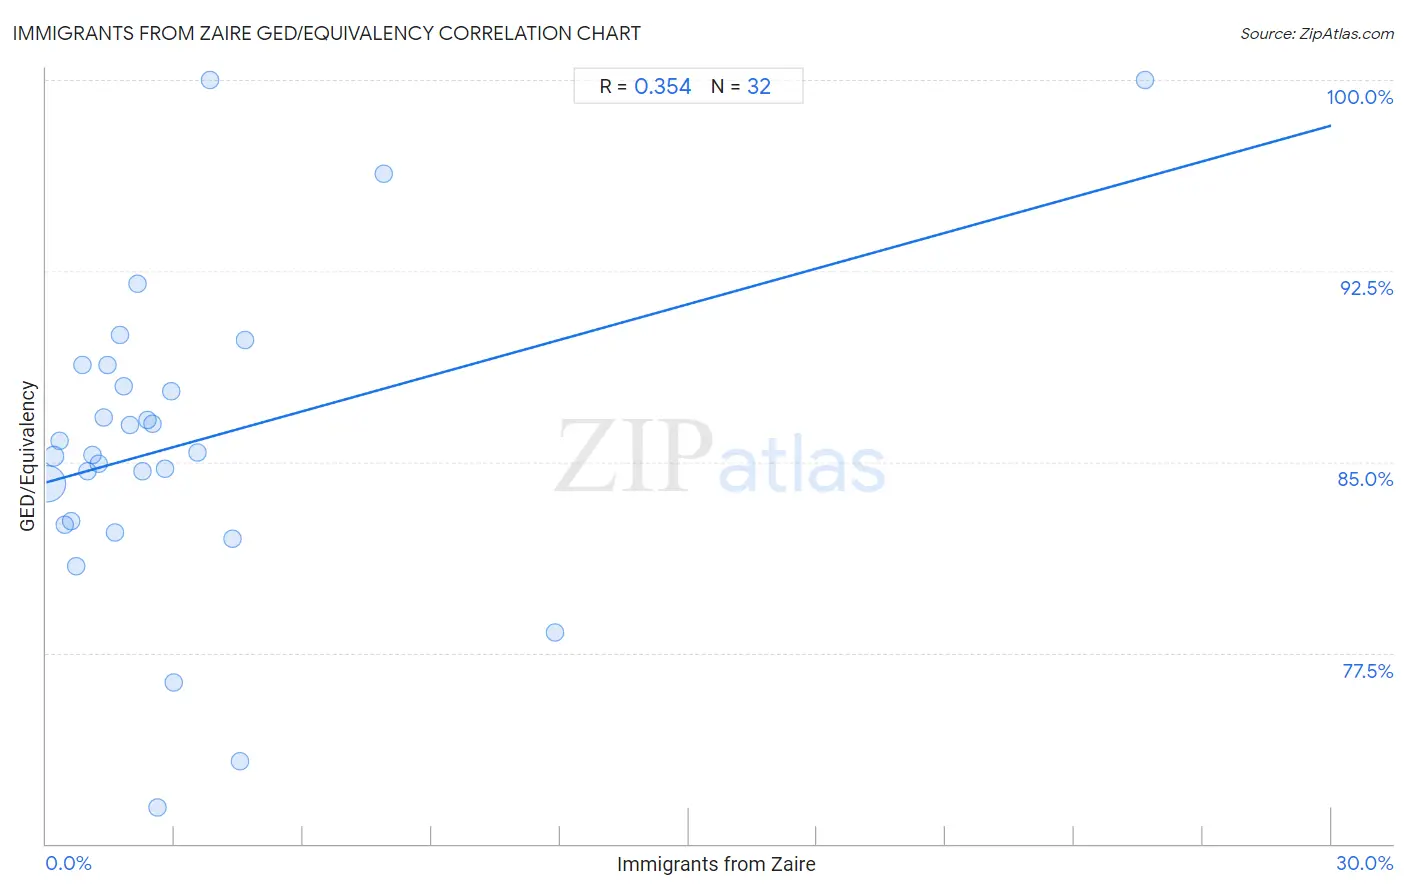
Immigrants from Zaire GED/Equivalency Correlation Chart

The statistical analysis conducted on geographies consisting of 107,255,805 people shows a mild positive correlation between the proportion of Immigrants from Zaire and percentage of population with at least ged/equivalency education in the United States with a correlation coefficient (R) of 0.354 and weighted average of 84.5%. On average, for every 1% (one percent) increase in Immigrants from Zaire within a typical geography, there is an increase of 0.47% in percentage of population with at least ged/equivalency education.
Immigrants from Zaire GED/Equivalency
It is essential to understand that the correlation between the percentage of Immigrants from Zaire and percentage of population with at least ged/equivalency education does not imply a direct cause-and-effect relationship. It remains uncertain whether the presence of Immigrants from Zaire influences an upward or downward trend in the level of percentage of population with at least ged/equivalency education within an area, or if Immigrants from Zaire simply ended up residing in those areas with higher or lower levels of percentage of population with at least ged/equivalency education due to other factors.

Demographics Similar to Immigrants from Zaire by GED/Equivalency

In terms of ged/equivalency, the demographic groups most similar to Immigrants from Zaire are Immigrants from Costa Rica (84.5%, a difference of 0.010%), Immigrants from Thailand (84.5%, a difference of 0.020%), Immigrants from Liberia (84.4%, a difference of 0.070%), French American Indian (84.6%, a difference of 0.080%), and Immigrants from Uruguay (84.4%, a difference of 0.10%).
DemographicsRating | RankGED/Equivalency
Potawatomi
8.2
/100
|
#219
Tragic
84.7%
Americans
8.2
/100
|
#220
Tragic
84.7%
Taiwanese
8.1
/100
|
#221
Tragic
84.7%
Iroquois
7.5
/100
|
#222
Tragic
84.6%
Immigrants from Uzbekistan
7.1
/100
|
#223
Tragic
84.6%
French American Indians
6.3
/100
|
#224
Tragic
84.6%
Immigrants from Thailand
5.8
/100
|
#225
Tragic
84.5%
Immigrants from Zaire
5.5
/100
|
#226
Tragic
84.5%
Immigrants from Costa Rica
5.4
/100
|
#227
Tragic
84.5%
Immigrants from Liberia
4.9
/100
|
#228
Tragic
84.4%
Immigrants from Uruguay
4.6
/100
|
#229
Tragic
84.4%
Immigrants from Colombia
4.5
/100
|
#230
Tragic
84.4%
Immigrants from Middle Africa
4.3
/100
|
#231
Tragic
84.4%
Immigrants from South America
4.2
/100
|
#232
Tragic
84.4%
Immigrants from Panama
4.1
/100
|
#233
Tragic
84.4%

Immigrants from Zaire GED/Equivalency Correlation Summary

MeasurementImmigrants from Zaire DataGED/Equivalency Data
Minimum0.034%71.4%
Maximum25.6%100.0%
Range25.6%28.6%
Mean3.2%85.7%
Median2.1%85.3%
Interquartile 25% (IQ1)1.0%82.6%
Interquartile 75% (IQ3)3.3%88.4%
Interquartile Range (IQR)2.2%5.8%
Standard Deviation (Sample)4.7%6.2%
Standard Deviation (Population)4.7%6.1%

Correlation Details

Immigrants from Zaire PercentileSample SizeGED/Equivalency
[
0.0%
-
0.5%
]
0.034%
85,966,50384.2%
[
0.0%
-
0.5%
]
0.18%
11,596,43085.2%
[
0.0%
-
0.5%
]
0.31%
3,926,07985.8%
[
0.0%
-
0.5%
]
0.44%
2,401,36782.5%
[
0.5%
-
1.0%
]
0.58%
924,93882.7%
[
0.5%
-
1.0%
]
0.69%
446,01280.9%
[
0.5%
-
1.0%
]
0.83%
452,78788.8%
[
0.5%
-
1.0%
]
0.97%
319,50984.6%
[
1.0%
-
1.5%
]
1.09%
351,58085.3%
[
1.0%
-
1.5%
]
1.24%
182,59284.9%
[
1.0%
-
1.5%
]
1.34%
152,27586.7%
[
1.0%
-
1.5%
]
1.44%
48,35588.8%
[
1.5%
-
2.0%
]
1.61%
92,43182.2%
[
1.5%
-
2.0%
]
1.73%
8,32590.0%
[
1.5%
-
2.0%
]
1.81%
22,86088.0%
[
1.5%
-
2.0%
]
1.96%
63,03586.5%
[
2.0%
-
2.5%
]
2.14%
37,92692.0%
[
2.0%
-
2.5%
]
2.26%
23,42884.6%
[
2.0%
-
2.5%
]
2.36%
36,39086.6%
[
2.0%
-
2.5%
]
2.48%
63,39486.5%
[
2.5%
-
3.0%
]
2.60%
12,36571.4%
[
2.5%
-
3.0%
]
2.76%
72484.7%
[
2.5%
-
3.0%
]
2.92%
67,13487.8%
[
2.5%
-
3.0%
]
2.98%
8,68176.4%
[
3.5%
-
4.0%
]
3.54%
4,80985.4%
[
3.5%
-
4.0%
]
3.81%
105100.0%
[
4.0%
-
4.5%
]
4.34%
36982.0%
[
4.5%
-
5.0%
]
4.52%
43,11073.2%
[
4.5%
-
5.0%
]
4.64%
1,20889.8%
[
7.5%
-
8.0%
]
7.88%
86396.3%
[
11.5%
-
12.0%
]
11.89%
14378.3%
[
25.5%
-
26.0%
]
25.64%
78100.0%