Immigrants from Zaire Disability Age Under 5
COMPARE
Immigrants from Zaire
Select to Compare
Disability Age Under 5
Immigrants from Zaire Disability Age Under 5
1.1%
DISABILITY | AGE UNDER 5
97.8/ 100
METRIC RATING
84th/ 347
METRIC RANK
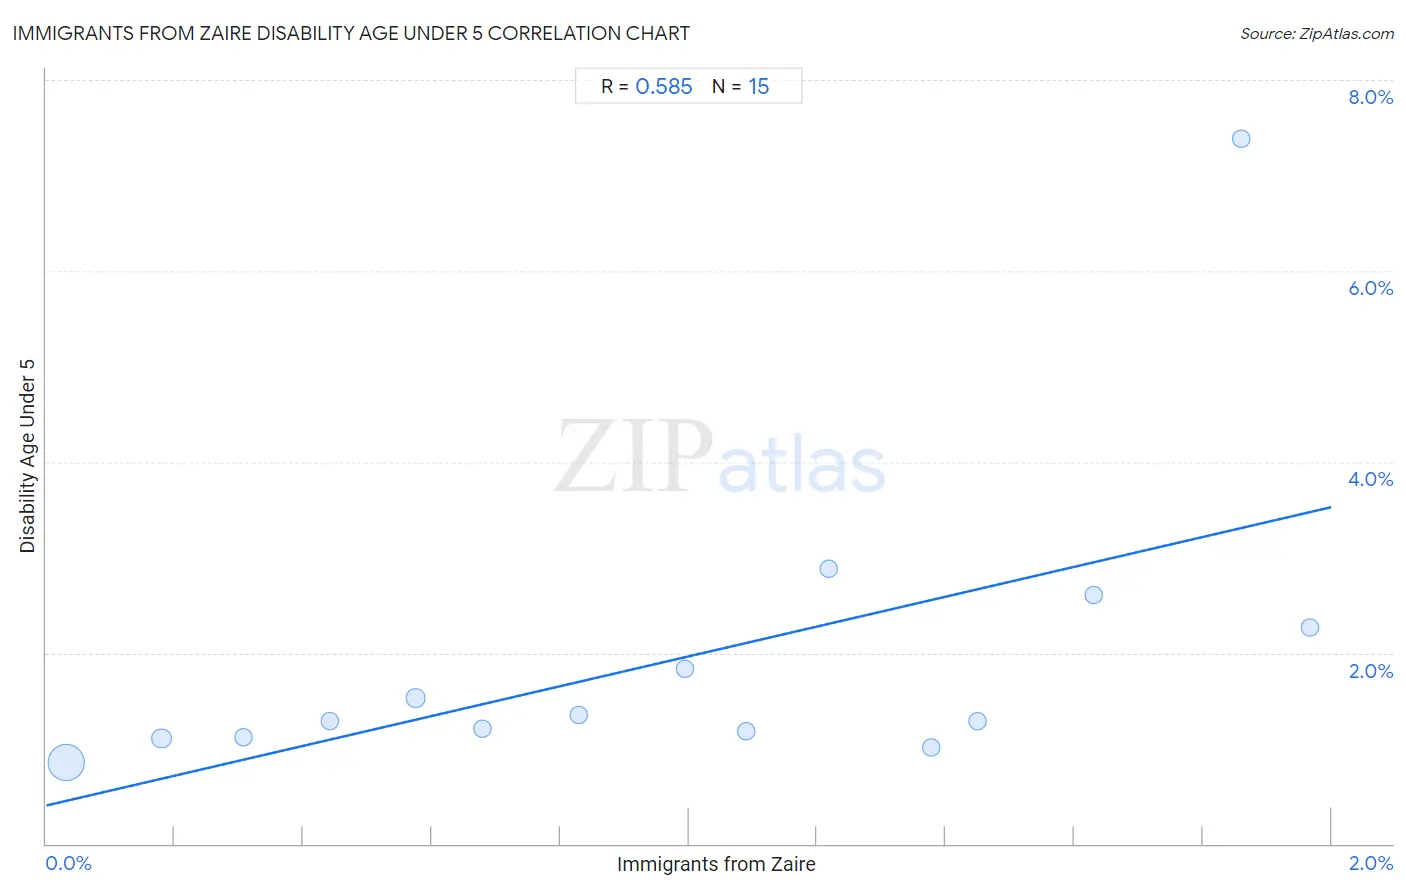
Immigrants from Zaire Disability Age Under 5 Correlation Chart
The statistical analysis conducted on geographies consisting of 82,804,930 people shows a substantial positive correlation between the proportion of Immigrants from Zaire and percentage of population with a disability under the age of 5 in the United States with a correlation coefficient (R) of 0.585 and weighted average of 1.1%. On average, for every 1% (one percent) increase in Immigrants from Zaire within a typical geography, there is an increase of 1.6% in percentage of population with a disability under the age of 5.
It is essential to understand that the correlation between the percentage of Immigrants from Zaire and percentage of population with a disability under the age of 5 does not imply a direct cause-and-effect relationship. It remains uncertain whether the presence of Immigrants from Zaire influences an upward or downward trend in the level of percentage of population with a disability under the age of 5 within an area, or if Immigrants from Zaire simply ended up residing in those areas with higher or lower levels of percentage of population with a disability under the age of 5 due to other factors.
Demographics Similar to Immigrants from Zaire by Disability Age Under 5
In terms of disability age under 5, the demographic groups most similar to Immigrants from Zaire are Sudanese (1.1%, a difference of 0.080%), Immigrants from Syria (1.1%, a difference of 0.15%), Immigrants from Jordan (1.1%, a difference of 0.16%), Okinawan (1.1%, a difference of 0.20%), and Ugandan (1.1%, a difference of 0.22%).
| Demographics | Rating | Rank | Disability Age Under 5 |
| Immigrants from Denmark | 98.1 /100 | #77 | Exceptional 1.1% |
| West Indians | 98.0 /100 | #78 | Exceptional 1.1% |
| Hmong | 98.0 /100 | #79 | Exceptional 1.1% |
| Immigrants from Trinidad and Tobago | 98.0 /100 | #80 | Exceptional 1.1% |
| Turks | 98.0 /100 | #81 | Exceptional 1.1% |
| Immigrants from Jordan | 97.9 /100 | #82 | Exceptional 1.1% |
| Immigrants from Syria | 97.9 /100 | #83 | Exceptional 1.1% |
| Immigrants from Zaire | 97.8 /100 | #84 | Exceptional 1.1% |
| Sudanese | 97.7 /100 | #85 | Exceptional 1.1% |
| Okinawans | 97.6 /100 | #86 | Exceptional 1.1% |
| Ugandans | 97.5 /100 | #87 | Exceptional 1.1% |
| Immigrants from Dominican Republic | 97.5 /100 | #88 | Exceptional 1.1% |
| Ethiopians | 97.2 /100 | #89 | Exceptional 1.1% |
| Chinese | 97.2 /100 | #90 | Exceptional 1.1% |
| Albanians | 97.2 /100 | #91 | Exceptional 1.1% |
Immigrants from Zaire Disability Age Under 5 Correlation Summary
| Measurement | Immigrants from Zaire Data | Disability Age Under 5 Data |
| Minimum | 0.031% | 0.85% |
| Maximum | 2.0% | 7.4% |
| Range | 1.9% | 6.5% |
| Mean | 0.98% | 1.9% |
| Median | 0.99% | 1.3% |
| Interquartile 25% (IQ1) | 0.44% | 1.1% |
| Interquartile 75% (IQ3) | 1.4% | 2.3% |
| Interquartile Range (IQR) | 1.0% | 1.2% |
| Standard Deviation (Sample) | 0.61% | 1.6% |
| Standard Deviation (Population) | 0.59% | 1.6% |
Correlation Details
| Immigrants from Zaire Percentile | Sample Size | Disability Age Under 5 |
[ 0.0% - 0.5% ] 0.031% | 71,292,811 | 0.85% |
[ 0.0% - 0.5% ] 0.18% | 7,186,665 | 1.1% |
[ 0.0% - 0.5% ] 0.31% | 1,880,756 | 1.1% |
[ 0.0% - 0.5% ] 0.44% | 1,107,353 | 1.3% |
[ 0.5% - 1.0% ] 0.57% | 456,910 | 1.5% |
[ 0.5% - 1.0% ] 0.68% | 158,885 | 1.2% |
[ 0.5% - 1.0% ] 0.83% | 100,508 | 1.3% |
[ 0.5% - 1.0% ] 0.99% | 170,960 | 1.8% |
[ 1.0% - 1.5% ] 1.09% | 198,523 | 1.2% |
[ 1.0% - 1.5% ] 1.22% | 104,376 | 2.9% |
[ 1.0% - 1.5% ] 1.38% | 67,256 | 1.0% |
[ 1.0% - 1.5% ] 1.45% | 31,892 | 1.3% |
[ 1.5% - 2.0% ] 1.63% | 23,980 | 2.6% |
[ 1.5% - 2.0% ] 1.86% | 1,936 | 7.4% |
[ 1.5% - 2.0% ] 1.97% | 22,119 | 2.3% |