Immigrants from Zaire 1 or more Vehicles in Household

COMPARE

Immigrants from Zaire
Race
Ancestry
AfghanAfricanAlaska NativeAlaskan AthabascanAlbanianAleutAlsatianAmericanApacheArabArapahoArgentineanArmenianAssyrian/Chaldean/SyriacAustralianAustrianBahamianBangladeshiBarbadianBasqueBelgianBelizeanBermudanBhutaneseBlackfeetBolivianBrazilianBritishBritish West IndianBulgarianBurmeseCajunCambodianCanadianCape VerdeanCarpatho RusynCelticCentral AmericanCentral American IndianCherokeeCheyenneChickasawChileanChineseChippewaChoctawColombianColvilleComancheCosta RicanCreeCreekCroatianCrowCubanCypriotCzechCzechoslovakianDanishDelawareDominicanDutchDutch West IndianEastern EuropeanEcuadorianEgyptianEnglishEstonianEthiopianEuropeanFijianFilipinoFinnishFrenchFrench American IndianFrench CanadianGermanGerman RussianGhanaianGreekGuamanian/ChamorroGuatemalanGuyaneseHaitianHmongHonduranHopiHoumaHungarianIcelanderIndian (Asian)IndonesianInupiatIranianIraqiIrishIroquoisIsraeliItalianJamaicanJapaneseJordanianKenyanKiowaKoreanLaotianLatvianLebaneseLiberianLithuanianLumbeeLuxembourgerMacedonianMalaysianMalteseMarshalleseMenomineeMexicanMexican American IndianMongolianMoroccanNative HawaiianNavajoNepaleseNew ZealanderNicaraguanNigerianNorthern EuropeanNorwegianOkinawanOsageOttawaPaiutePakistaniPalestinianPanamanianParaguayanPennsylvania GermanPeruvianPimaPolishPortuguesePotawatomiPuebloPuerto RicanPuget Sound SalishRomanianRussianSalvadoranSamoanScandinavianScotch-IrishScottishSeminoleSenegaleseSerbianShoshoneSierra LeoneanSiouxSlavicSlovakSloveneSomaliSouth AfricanSouth AmericanSouth American IndianSoviet UnionSpaniardSpanishSpanish AmericanSpanish American IndianSri LankanSubsaharan AfricanSudaneseSwedishSwissSyrianTaiwaneseThaiTlingit-HaidaTohono O'OdhamTonganTrinidadian and TobagonianTsimshianTurkishU.S. Virgin IslanderUgandanUkrainianUruguayanUteVenezuelanVietnameseWelshWest IndianYakamaYaquiYugoslavianYumanYup'ikZimbabwean
Immigration
NonimmigrantsImmigrantsAfghanistanAfricaAlbaniaArgentinaArmeniaAsiaAustraliaAustriaBahamasBangladeshBarbadosBelarusBelgiumBelizeBoliviaBosnia and HerzegovinaBrazilBulgariaBurma/MyanmarCabo VerdeCambodiaCameroonCanadaCaribbeanCentral AmericaChileChinaColombiaCongoCosta RicaCroatiaCubaCzechoslovakiaDenmarkDominicaDominican RepublicEastern AfricaEastern AsiaEastern EuropeEcuadorEgyptEl SalvadorEnglandEritreaEthiopiaEuropeFijiFranceGermanyGhanaGreeceGrenadaGuatemalaGuyanaHaitiHondurasHong KongHungaryIndiaIndonesiaIranIraqIrelandIsraelItalyJamaicaJapanJordanKazakhstanKenyaKoreaKuwaitLaosLatin AmericaLatviaLebanonLiberiaLithuaniaMalaysiaMexicoMicronesiaMiddle AfricaMoldovaMoroccoNepalNetherlandsNicaraguaNigeriaNorth AmericaNorth MacedoniaNorthern AfricaNorthern EuropeNorwayOceaniaPakistanPanamaPeruPhilippinesPolandPortugalRomaniaRussiaSaudi ArabiaScotlandSenegalSerbiaSierra LeoneSingaporeSomaliaSouth AfricaSouth AmericaSouth Central AsiaSouth Eastern AsiaSouthern EuropeSpainSri LankaSt. Vincent and the GrenadinesSudanSwedenSwitzerlandSyriaTaiwanThailandTrinidad and TobagoTurkeyUgandaUkraineUruguayUzbekistanVenezuelaVietnamWest IndiesWestern AfricaWestern AsiaWestern EuropeYemenZaireZimbabweAzores
Select to Compare
Race
Ancestry
AfghanAfricanAlaska NativeAlaskan AthabascanAlbanianAleutAlsatianAmericanApacheArabArapahoArgentineanArmenianAssyrian/Chaldean/SyriacAustralianAustrianBahamianBangladeshiBarbadianBasqueBelgianBelizeanBermudanBhutaneseBlackfeetBolivianBrazilianBritishBritish West IndianBulgarianBurmeseCajunCambodianCanadianCape VerdeanCarpatho RusynCelticCentral AmericanCentral American IndianCherokeeCheyenneChickasawChileanChineseChippewaChoctawColombianColvilleComancheCosta RicanCreeCreekCroatianCrowCubanCypriotCzechCzechoslovakianDanishDelawareDominicanDutchDutch West IndianEastern EuropeanEcuadorianEgyptianEnglishEstonianEthiopianEuropeanFijianFilipinoFinnishFrenchFrench American IndianFrench CanadianGermanGerman RussianGhanaianGreekGuamanian/ChamorroGuatemalanGuyaneseHaitianHmongHonduranHopiHoumaHungarianIcelanderIndian (Asian)IndonesianInupiatIranianIraqiIrishIroquoisIsraeliItalianJamaicanJapaneseJordanianKenyanKiowaKoreanLaotianLatvianLebaneseLiberianLithuanianLumbeeLuxembourgerMacedonianMalaysianMalteseMarshalleseMenomineeMexicanMexican American IndianMongolianMoroccanNative HawaiianNavajoNepaleseNew ZealanderNicaraguanNigerianNorthern EuropeanNorwegianOkinawanOsageOttawaPaiutePakistaniPalestinianPanamanianParaguayanPennsylvania GermanPeruvianPimaPolishPortuguesePotawatomiPuebloPuerto RicanPuget Sound SalishRomanianRussianSalvadoranSamoanScandinavianScotch-IrishScottishSeminoleSenegaleseSerbianShoshoneSierra LeoneanSiouxSlavicSlovakSloveneSomaliSouth AfricanSouth AmericanSouth American IndianSoviet UnionSpaniardSpanishSpanish AmericanSpanish American IndianSri LankanSubsaharan AfricanSudaneseSwedishSwissSyrianTaiwaneseThaiTlingit-HaidaTohono O'OdhamTonganTrinidadian and TobagonianTsimshianTurkishU.S. Virgin IslanderUgandanUkrainianUruguayanUteVenezuelanVietnameseWelshWest IndianYakamaYaquiYugoslavianYumanYup'ikZimbabwean
Immigration
NonimmigrantsImmigrantsAfghanistanAfricaAlbaniaArgentinaArmeniaAsiaAustraliaAustriaBahamasBangladeshBarbadosBelarusBelgiumBelizeBoliviaBosnia and HerzegovinaBrazilBulgariaBurma/MyanmarCabo VerdeCambodiaCameroonCanadaCaribbeanCentral AmericaChileChinaColombiaCongoCosta RicaCroatiaCubaCzechoslovakiaDenmarkDominicaDominican RepublicEastern AfricaEastern AsiaEastern EuropeEcuadorEgyptEl SalvadorEnglandEritreaEthiopiaEuropeFijiFranceGermanyGhanaGreeceGrenadaGuatemalaGuyanaHaitiHondurasHong KongHungaryIndiaIndonesiaIranIraqIrelandIsraelItalyJamaicaJapanJordanKazakhstanKenyaKoreaKuwaitLaosLatin AmericaLatviaLebanonLiberiaLithuaniaMalaysiaMexicoMicronesiaMiddle AfricaMoldovaMoroccoNepalNetherlandsNicaraguaNigeriaNorth AmericaNorth MacedoniaNorthern AfricaNorthern EuropeNorwayOceaniaPakistanPanamaPeruPhilippinesPolandPortugalRomaniaRussiaSaudi ArabiaScotlandSenegalSerbiaSierra LeoneSingaporeSomaliaSouth AfricaSouth AmericaSouth Central AsiaSouth Eastern AsiaSouthern EuropeSpainSri LankaSt. Vincent and the GrenadinesSudanSwedenSwitzerlandSyriaTaiwanThailandTrinidad and TobagoTurkeyUgandaUkraineUruguayUzbekistanVenezuelaVietnamWest IndiesWestern AfricaWestern AsiaWestern EuropeYemenZimbabweAzores
1 or more Vehicles in Household
Income
Poverty
Unemployment
Labor Participation
Family Structure
Vehicle Availability
Education Level
Disability

Immigrants from Zaire 1 or more Vehicles in Household
Tragic

88.8%
1+ VEHICLES AVAILABLE
8.1/ 100
METRIC RATING
220th/ 347
METRIC RANK

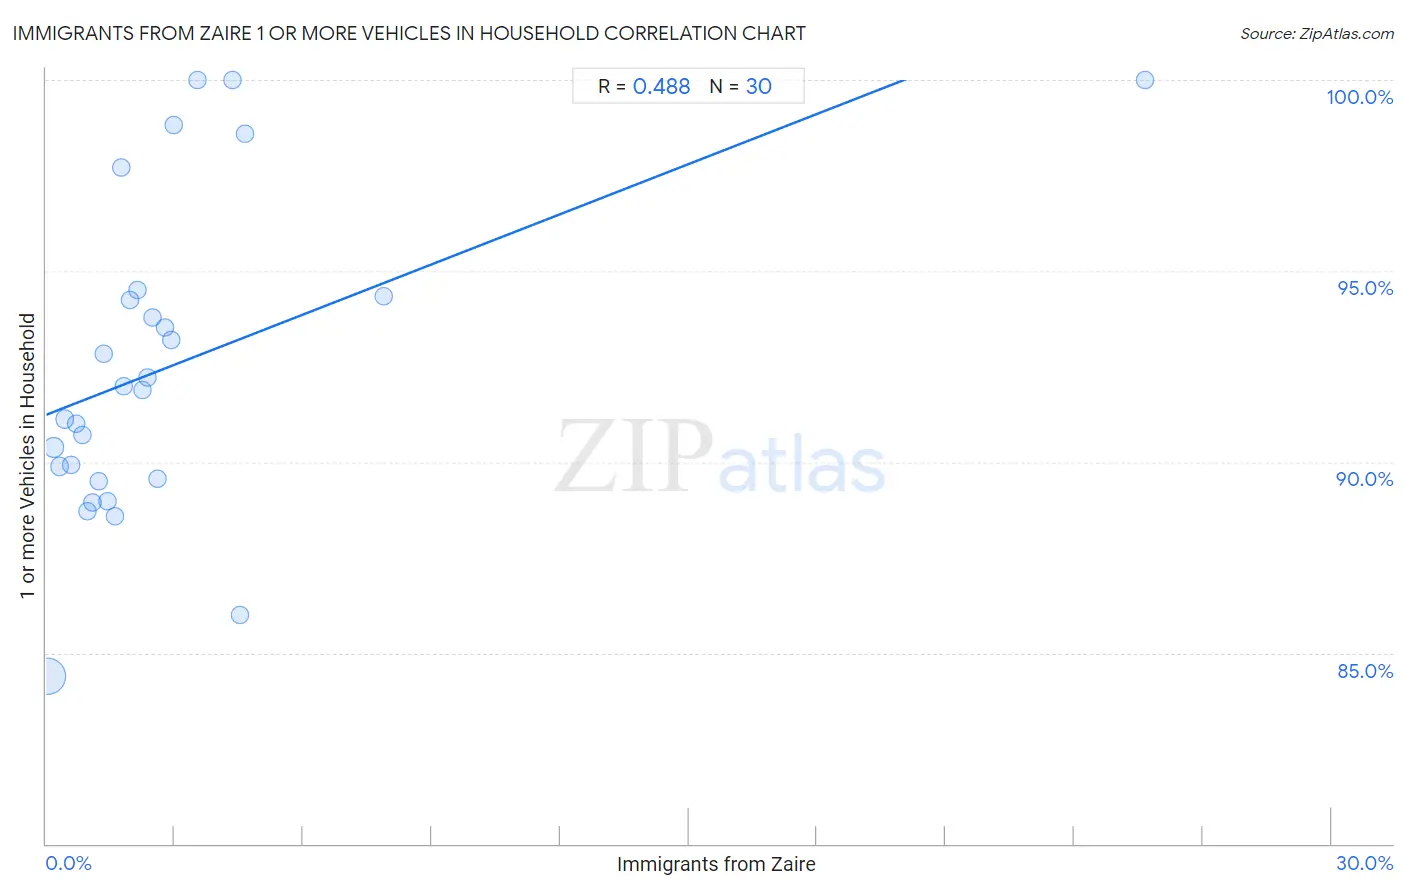
Immigrants from Zaire 1 or more Vehicles in Household Correlation Chart

The statistical analysis conducted on geographies consisting of 107,246,664 people shows a moderate positive correlation between the proportion of Immigrants from Zaire and percentage of households with 1 or more vehicles available in the United States with a correlation coefficient (R) of 0.488 and weighted average of 88.8%. On average, for every 1% (one percent) increase in Immigrants from Zaire within a typical geography, there is an increase of 0.44% in percentage of households with 1 or more vehicles available.
Immigrants from Zaire 1 or more Vehicles in Household
It is essential to understand that the correlation between the percentage of Immigrants from Zaire and percentage of households with 1 or more vehicles available does not imply a direct cause-and-effect relationship. It remains uncertain whether the presence of Immigrants from Zaire influences an upward or downward trend in the level of percentage of households with 1 or more vehicles available within an area, or if Immigrants from Zaire simply ended up residing in those areas with higher or lower levels of percentage of households with 1 or more vehicles available due to other factors.

Demographics Similar to Immigrants from Zaire by 1 or more Vehicles in Household

In terms of 1 or more vehicles in household, the demographic groups most similar to Immigrants from Zaire are Peruvian (88.8%, a difference of 0.010%), Ugandan (88.9%, a difference of 0.030%), Immigrants from Guatemala (88.9%, a difference of 0.030%), Argentinean (88.9%, a difference of 0.040%), and Immigrants from Argentina (88.9%, a difference of 0.070%).
DemographicsRating | Rank1 or more Vehicles in Household
Immigrants from Western Asia
12.3
/100
|
#213
Poor
89.0%
Immigrants from Hungary
11.9
/100
|
#214
Poor
89.0%
Immigrants from Sri Lanka
10.2
/100
|
#215
Poor
88.9%
Immigrants from Argentina
9.4
/100
|
#216
Tragic
88.9%
Argentineans
8.8
/100
|
#217
Tragic
88.9%
Ugandans
8.7
/100
|
#218
Tragic
88.9%
Immigrants from Guatemala
8.6
/100
|
#219
Tragic
88.9%
Immigrants from Zaire
8.1
/100
|
#220
Tragic
88.8%
Peruvians
7.9
/100
|
#221
Tragic
88.8%
Uruguayans
7.0
/100
|
#222
Tragic
88.8%
Immigrants from South America
7.0
/100
|
#223
Tragic
88.8%
Immigrants from Hong Kong
6.2
/100
|
#224
Tragic
88.7%
Cree
6.0
/100
|
#225
Tragic
88.7%
Cheyenne
5.7
/100
|
#226
Tragic
88.7%
Ute
5.6
/100
|
#227
Tragic
88.7%

Immigrants from Zaire 1 or more Vehicles in Household Correlation Summary

MeasurementImmigrants from Zaire Data1 or more Vehicles in Household Data
Minimum0.034%84.4%
Maximum25.6%100.0%
Range25.6%15.6%
Mean2.9%92.5%
Median1.9%91.9%
Interquartile 25% (IQ1)0.97%89.6%
Interquartile 75% (IQ3)2.9%94.4%
Interquartile Range (IQR)1.9%4.8%
Standard Deviation (Sample)4.6%4.1%
Standard Deviation (Population)4.5%4.1%

Correlation Details

Immigrants from Zaire PercentileSample Size1 or more Vehicles in Household
[
0.0%
-
0.5%
]
0.034%
85,966,50384.4%
[
0.0%
-
0.5%
]
0.18%
11,591,03390.4%
[
0.0%
-
0.5%
]
0.31%
3,926,07989.9%
[
0.0%
-
0.5%
]
0.44%
2,400,04891.1%
[
0.5%
-
1.0%
]
0.58%
924,93889.9%
[
0.5%
-
1.0%
]
0.69%
446,01291.0%
[
0.5%
-
1.0%
]
0.83%
452,78790.7%
[
0.5%
-
1.0%
]
0.97%
319,50988.7%
[
1.0%
-
1.5%
]
1.09%
351,58088.9%
[
1.0%
-
1.5%
]
1.24%
182,59289.5%
[
1.0%
-
1.5%
]
1.34%
152,27592.8%
[
1.0%
-
1.5%
]
1.44%
48,35589.0%
[
1.5%
-
2.0%
]
1.61%
92,43188.6%
[
1.5%
-
2.0%
]
1.74%
6,14897.7%
[
1.5%
-
2.0%
]
1.81%
22,86092.0%
[
1.5%
-
2.0%
]
1.96%
63,03594.2%
[
2.0%
-
2.5%
]
2.14%
37,92694.5%
[
2.0%
-
2.5%
]
2.26%
23,42891.9%
[
2.0%
-
2.5%
]
2.36%
36,39092.2%
[
2.0%
-
2.5%
]
2.48%
63,39493.8%
[
2.5%
-
3.0%
]
2.60%
12,36589.6%
[
2.5%
-
3.0%
]
2.76%
72493.5%
[
2.5%
-
3.0%
]
2.92%
67,13493.2%
[
2.5%
-
3.0%
]
2.98%
8,68198.8%
[
3.5%
-
4.0%
]
3.54%
4,809100.0%
[
4.0%
-
4.5%
]
4.34%
369100.0%
[
4.5%
-
5.0%
]
4.52%
43,11086.0%
[
4.5%
-
5.0%
]
4.64%
1,20898.6%
[
7.5%
-
8.0%
]
7.88%
86394.4%
[
25.5%
-
26.0%
]
25.64%
78100.0%