Immigrants from Oceania Disability Age Under 5
COMPARE
Immigrants from Oceania
Select to Compare
Disability Age Under 5
Immigrants from Oceania Disability Age Under 5
1.2%
DISABILITY | AGE UNDER 5
94.2/ 100
METRIC RATING
113th/ 347
METRIC RANK
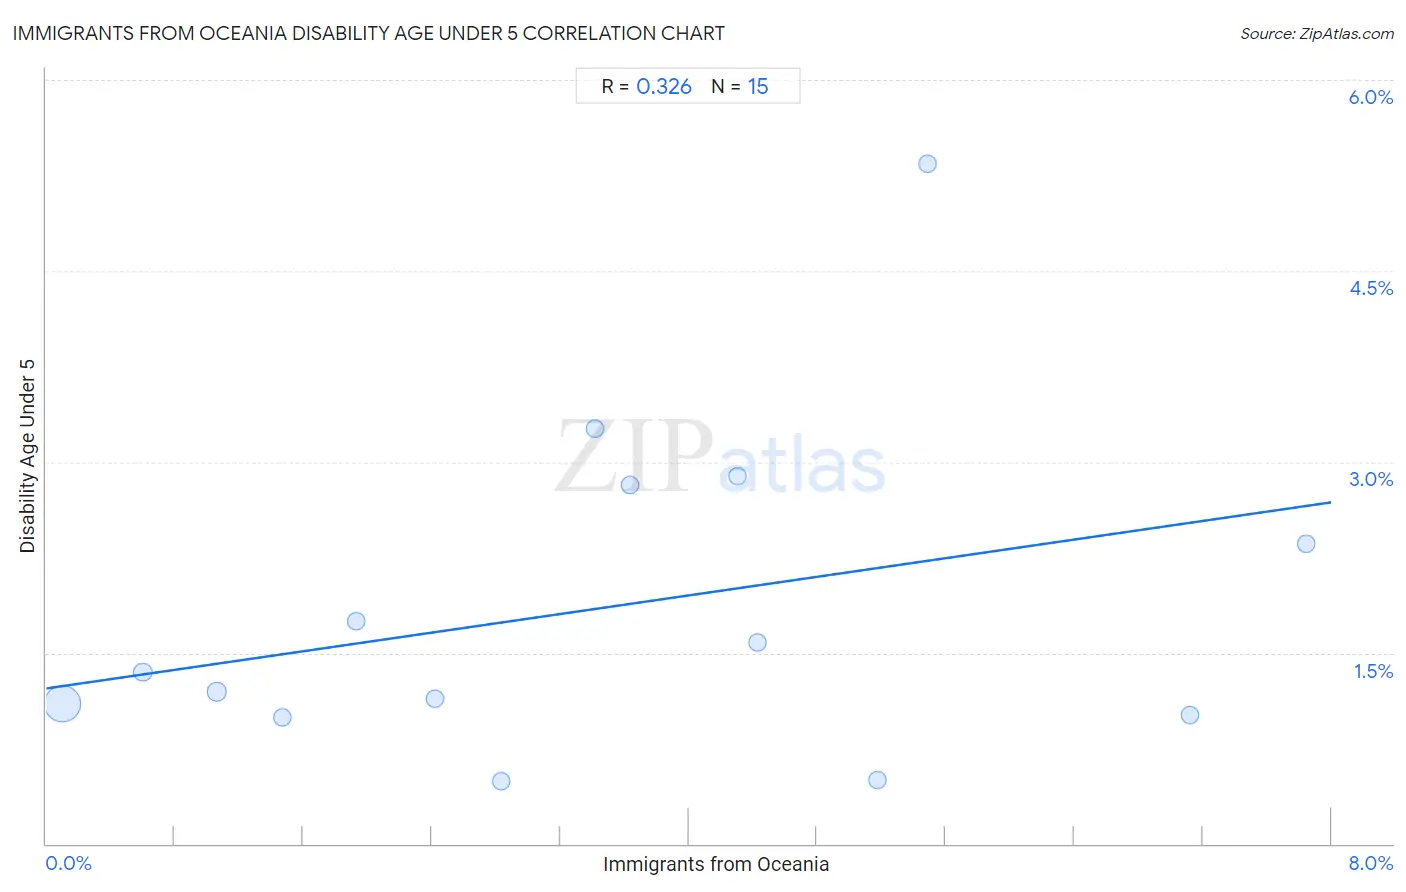
Immigrants from Oceania Disability Age Under 5 Correlation Chart
The statistical analysis conducted on geographies consisting of 180,365,611 people shows a mild positive correlation between the proportion of Immigrants from Oceania and percentage of population with a disability under the age of 5 in the United States with a correlation coefficient (R) of 0.326 and weighted average of 1.2%. On average, for every 1% (one percent) increase in Immigrants from Oceania within a typical geography, there is an increase of 0.18% in percentage of population with a disability under the age of 5.
It is essential to understand that the correlation between the percentage of Immigrants from Oceania and percentage of population with a disability under the age of 5 does not imply a direct cause-and-effect relationship. It remains uncertain whether the presence of Immigrants from Oceania influences an upward or downward trend in the level of percentage of population with a disability under the age of 5 within an area, or if Immigrants from Oceania simply ended up residing in those areas with higher or lower levels of percentage of population with a disability under the age of 5 due to other factors.
Demographics Similar to Immigrants from Oceania by Disability Age Under 5
In terms of disability age under 5, the demographic groups most similar to Immigrants from Oceania are Immigrants from Australia (1.2%, a difference of 0.060%), Belizean (1.2%, a difference of 0.15%), Immigrants from Caribbean (1.2%, a difference of 0.16%), Senegalese (1.2%, a difference of 0.17%), and Immigrants from Northern Africa (1.2%, a difference of 0.18%).
| Demographics | Rating | Rank | Disability Age Under 5 |
| Cambodians | 95.4 /100 | #106 | Exceptional 1.2% |
| Immigrants from West Indies | 95.3 /100 | #107 | Exceptional 1.2% |
| Iraqis | 95.1 /100 | #108 | Exceptional 1.2% |
| Immigrants from Panama | 95.0 /100 | #109 | Exceptional 1.2% |
| Immigrants from Lebanon | 95.0 /100 | #110 | Exceptional 1.2% |
| Senegalese | 94.6 /100 | #111 | Exceptional 1.2% |
| Immigrants from Australia | 94.4 /100 | #112 | Exceptional 1.2% |
| Immigrants from Oceania | 94.2 /100 | #113 | Exceptional 1.2% |
| Belizeans | 93.9 /100 | #114 | Exceptional 1.2% |
| Immigrants from Caribbean | 93.8 /100 | #115 | Exceptional 1.2% |
| Immigrants from Northern Africa | 93.8 /100 | #116 | Exceptional 1.2% |
| Immigrants from Philippines | 93.5 /100 | #117 | Exceptional 1.2% |
| Immigrants from Venezuela | 93.4 /100 | #118 | Exceptional 1.2% |
| Bhutanese | 92.5 /100 | #119 | Exceptional 1.2% |
| Immigrants from Eritrea | 92.3 /100 | #120 | Exceptional 1.2% |
Immigrants from Oceania Disability Age Under 5 Correlation Summary
| Measurement | Immigrants from Oceania Data | Disability Age Under 5 Data |
| Minimum | 0.10% | 0.49% |
| Maximum | 7.8% | 5.3% |
| Range | 7.7% | 4.9% |
| Mean | 3.5% | 1.9% |
| Median | 3.4% | 1.3% |
| Interquartile 25% (IQ1) | 1.5% | 1.0% |
| Interquartile 75% (IQ3) | 5.2% | 2.8% |
| Interquartile Range (IQR) | 3.7% | 1.8% |
| Standard Deviation (Sample) | 2.3% | 1.3% |
| Standard Deviation (Population) | 2.2% | 1.2% |
Correlation Details
| Immigrants from Oceania Percentile | Sample Size | Disability Age Under 5 |
[ 0.0% - 0.5% ] 0.10% | 169,164,716 | 1.1% |
[ 0.5% - 1.0% ] 0.60% | 5,907,619 | 1.3% |
[ 1.0% - 1.5% ] 1.06% | 2,078,313 | 1.2% |
[ 1.0% - 1.5% ] 1.47% | 1,503,129 | 0.99% |
[ 1.5% - 2.0% ] 1.93% | 317,039 | 1.7% |
[ 2.0% - 2.5% ] 2.42% | 356,619 | 1.1% |
[ 2.5% - 3.0% ] 2.83% | 460,077 | 0.49% |
[ 3.0% - 3.5% ] 3.42% | 119,840 | 3.3% |
[ 3.5% - 4.0% ] 3.64% | 91,416 | 2.8% |
[ 4.0% - 4.5% ] 4.31% | 27,233 | 2.9% |
[ 4.0% - 4.5% ] 4.43% | 55,922 | 1.6% |
[ 5.0% - 5.5% ] 5.17% | 204,798 | 0.50% |
[ 5.0% - 5.5% ] 5.48% | 3,593 | 5.3% |
[ 7.0% - 7.5% ] 7.12% | 62,694 | 1.0% |
[ 7.5% - 8.0% ] 7.85% | 12,603 | 2.4% |