Immigrants from Oceania GED/Equivalency

COMPARE

Immigrants from Oceania
Race
Ancestry
AfghanAfricanAlaska NativeAlaskan AthabascanAlbanianAleutAlsatianAmericanApacheArabArapahoArgentineanArmenianAssyrian/Chaldean/SyriacAustralianAustrianBahamianBangladeshiBarbadianBasqueBelgianBelizeanBermudanBhutaneseBlackfeetBolivianBrazilianBritishBritish West IndianBulgarianBurmeseCajunCambodianCanadianCape VerdeanCarpatho RusynCelticCentral AmericanCentral American IndianCherokeeCheyenneChickasawChileanChineseChippewaChoctawColombianColvilleComancheCosta RicanCreeCreekCroatianCrowCubanCypriotCzechCzechoslovakianDanishDelawareDominicanDutchDutch West IndianEastern EuropeanEcuadorianEgyptianEnglishEstonianEthiopianEuropeanFijianFilipinoFinnishFrenchFrench American IndianFrench CanadianGermanGerman RussianGhanaianGreekGuamanian/ChamorroGuatemalanGuyaneseHaitianHmongHonduranHopiHoumaHungarianIcelanderIndian (Asian)IndonesianInupiatIranianIraqiIrishIroquoisIsraeliItalianJamaicanJapaneseJordanianKenyanKiowaKoreanLaotianLatvianLebaneseLiberianLithuanianLumbeeLuxembourgerMacedonianMalaysianMalteseMarshalleseMenomineeMexicanMexican American IndianMongolianMoroccanNative HawaiianNavajoNepaleseNew ZealanderNicaraguanNigerianNorthern EuropeanNorwegianOkinawanOsageOttawaPaiutePakistaniPalestinianPanamanianParaguayanPennsylvania GermanPeruvianPimaPolishPortuguesePotawatomiPuebloPuerto RicanPuget Sound SalishRomanianRussianSalvadoranSamoanScandinavianScotch-IrishScottishSeminoleSenegaleseSerbianShoshoneSierra LeoneanSiouxSlavicSlovakSloveneSomaliSouth AfricanSouth AmericanSouth American IndianSoviet UnionSpaniardSpanishSpanish AmericanSpanish American IndianSri LankanSubsaharan AfricanSudaneseSwedishSwissSyrianTaiwaneseThaiTlingit-HaidaTohono O'OdhamTonganTrinidadian and TobagonianTsimshianTurkishU.S. Virgin IslanderUgandanUkrainianUruguayanUteVenezuelanVietnameseWelshWest IndianYakamaYaquiYugoslavianYumanYup'ikZimbabwean
Immigration
NonimmigrantsImmigrantsAfghanistanAfricaAlbaniaArgentinaArmeniaAsiaAustraliaAustriaBahamasBangladeshBarbadosBelarusBelgiumBelizeBoliviaBosnia and HerzegovinaBrazilBulgariaBurma/MyanmarCabo VerdeCambodiaCameroonCanadaCaribbeanCentral AmericaChileChinaColombiaCongoCosta RicaCroatiaCubaCzechoslovakiaDenmarkDominicaDominican RepublicEastern AfricaEastern AsiaEastern EuropeEcuadorEgyptEl SalvadorEnglandEritreaEthiopiaEuropeFijiFranceGermanyGhanaGreeceGrenadaGuatemalaGuyanaHaitiHondurasHong KongHungaryIndiaIndonesiaIranIraqIrelandIsraelItalyJamaicaJapanJordanKazakhstanKenyaKoreaKuwaitLaosLatin AmericaLatviaLebanonLiberiaLithuaniaMalaysiaMexicoMicronesiaMiddle AfricaMoldovaMoroccoNepalNetherlandsNicaraguaNigeriaNorth AmericaNorth MacedoniaNorthern AfricaNorthern EuropeNorwayOceaniaPakistanPanamaPeruPhilippinesPolandPortugalRomaniaRussiaSaudi ArabiaScotlandSenegalSerbiaSierra LeoneSingaporeSomaliaSouth AfricaSouth AmericaSouth Central AsiaSouth Eastern AsiaSouthern EuropeSpainSri LankaSt. Vincent and the GrenadinesSudanSwedenSwitzerlandSyriaTaiwanThailandTrinidad and TobagoTurkeyUgandaUkraineUruguayUzbekistanVenezuelaVietnamWest IndiesWestern AfricaWestern AsiaWestern EuropeYemenZaireZimbabweAzores
Select to Compare
Race
Ancestry
AfghanAfricanAlaska NativeAlaskan AthabascanAlbanianAleutAlsatianAmericanApacheArabArapahoArgentineanArmenianAssyrian/Chaldean/SyriacAustralianAustrianBahamianBangladeshiBarbadianBasqueBelgianBelizeanBermudanBhutaneseBlackfeetBolivianBrazilianBritishBritish West IndianBulgarianBurmeseCajunCambodianCanadianCape VerdeanCarpatho RusynCelticCentral AmericanCentral American IndianCherokeeCheyenneChickasawChileanChineseChippewaChoctawColombianColvilleComancheCosta RicanCreeCreekCroatianCrowCubanCypriotCzechCzechoslovakianDanishDelawareDominicanDutchDutch West IndianEastern EuropeanEcuadorianEgyptianEnglishEstonianEthiopianEuropeanFijianFilipinoFinnishFrenchFrench American IndianFrench CanadianGermanGerman RussianGhanaianGreekGuamanian/ChamorroGuatemalanGuyaneseHaitianHmongHonduranHopiHoumaHungarianIcelanderIndian (Asian)IndonesianInupiatIranianIraqiIrishIroquoisIsraeliItalianJamaicanJapaneseJordanianKenyanKiowaKoreanLaotianLatvianLebaneseLiberianLithuanianLumbeeLuxembourgerMacedonianMalaysianMalteseMarshalleseMenomineeMexicanMexican American IndianMongolianMoroccanNative HawaiianNavajoNepaleseNew ZealanderNicaraguanNigerianNorthern EuropeanNorwegianOkinawanOsageOttawaPaiutePakistaniPalestinianPanamanianParaguayanPennsylvania GermanPeruvianPimaPolishPortuguesePotawatomiPuebloPuerto RicanPuget Sound SalishRomanianRussianSalvadoranSamoanScandinavianScotch-IrishScottishSeminoleSenegaleseSerbianShoshoneSierra LeoneanSiouxSlavicSlovakSloveneSomaliSouth AfricanSouth AmericanSouth American IndianSoviet UnionSpaniardSpanishSpanish AmericanSpanish American IndianSri LankanSubsaharan AfricanSudaneseSwedishSwissSyrianTaiwaneseThaiTlingit-HaidaTohono O'OdhamTonganTrinidadian and TobagonianTsimshianTurkishU.S. Virgin IslanderUgandanUkrainianUruguayanUteVenezuelanVietnameseWelshWest IndianYakamaYaquiYugoslavianYumanYup'ikZimbabwean
Immigration
NonimmigrantsImmigrantsAfghanistanAfricaAlbaniaArgentinaArmeniaAsiaAustraliaAustriaBahamasBangladeshBarbadosBelarusBelgiumBelizeBoliviaBosnia and HerzegovinaBrazilBulgariaBurma/MyanmarCabo VerdeCambodiaCameroonCanadaCaribbeanCentral AmericaChileChinaColombiaCongoCosta RicaCroatiaCubaCzechoslovakiaDenmarkDominicaDominican RepublicEastern AfricaEastern AsiaEastern EuropeEcuadorEgyptEl SalvadorEnglandEritreaEthiopiaEuropeFijiFranceGermanyGhanaGreeceGrenadaGuatemalaGuyanaHaitiHondurasHong KongHungaryIndiaIndonesiaIranIraqIrelandIsraelItalyJamaicaJapanJordanKazakhstanKenyaKoreaKuwaitLaosLatin AmericaLatviaLebanonLiberiaLithuaniaMalaysiaMexicoMicronesiaMiddle AfricaMoldovaMoroccoNepalNetherlandsNicaraguaNigeriaNorth AmericaNorth MacedoniaNorthern AfricaNorthern EuropeNorwayPakistanPanamaPeruPhilippinesPolandPortugalRomaniaRussiaSaudi ArabiaScotlandSenegalSerbiaSierra LeoneSingaporeSomaliaSouth AfricaSouth AmericaSouth Central AsiaSouth Eastern AsiaSouthern EuropeSpainSri LankaSt. Vincent and the GrenadinesSudanSwedenSwitzerlandSyriaTaiwanThailandTrinidad and TobagoTurkeyUgandaUkraineUruguayUzbekistanVenezuelaVietnamWest IndiesWestern AfricaWestern AsiaWestern EuropeYemenZaireZimbabweAzores
GED/Equivalency
Income
Poverty
Unemployment
Labor Participation
Family Structure
Vehicle Availability
Education Level
Disability

Immigrants from Oceania GED/Equivalency
Fair

85.5%
GED/EQUIVALENCY
33.6/ 100
METRIC RATING
184th/ 347
METRIC RANK

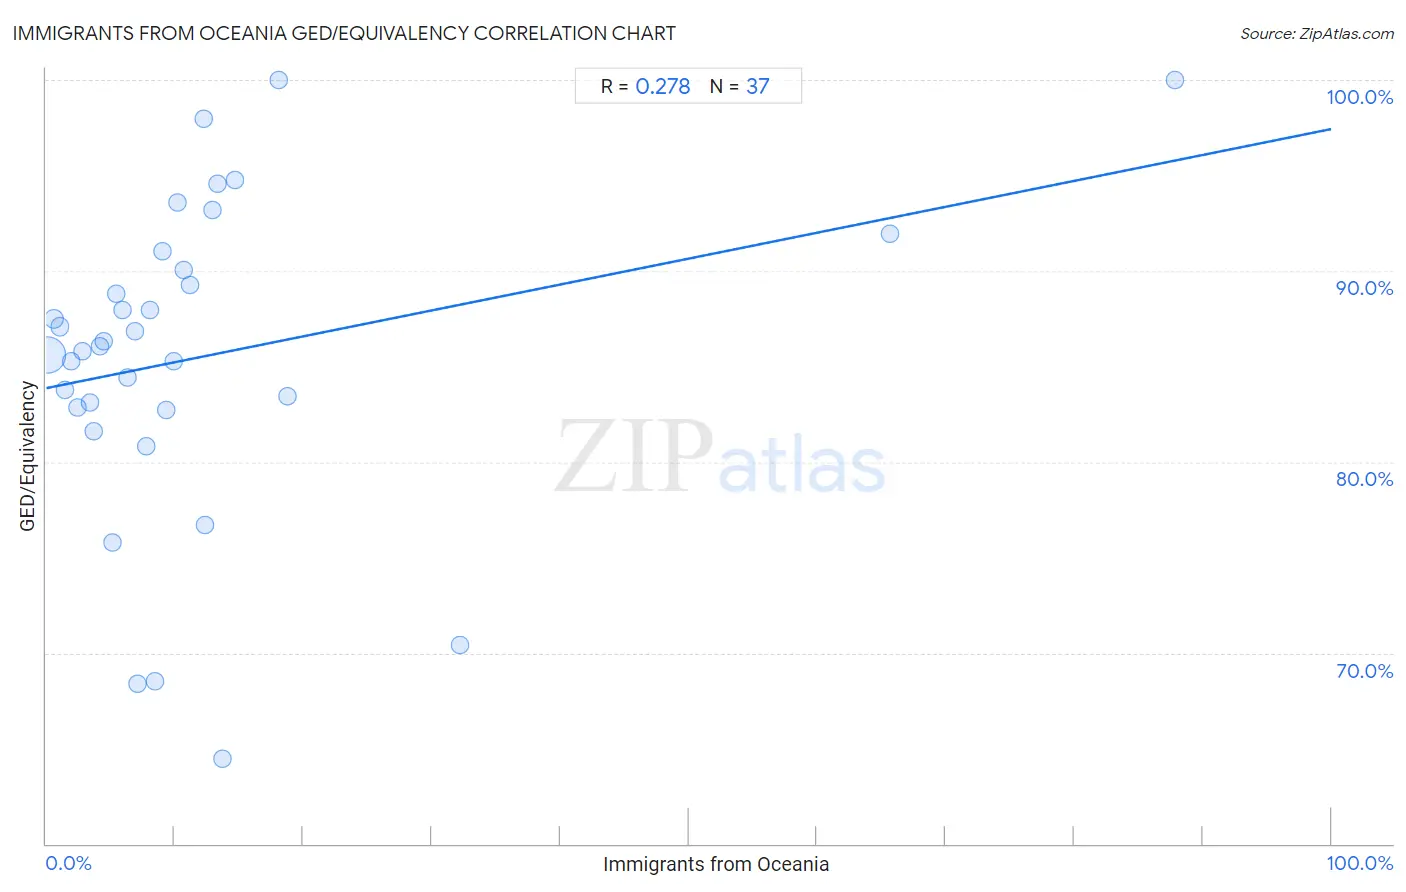
Immigrants from Oceania GED/Equivalency Correlation Chart

The statistical analysis conducted on geographies consisting of 305,521,521 people shows a weak positive correlation between the proportion of Immigrants from Oceania and percentage of population with at least ged/equivalency education in the United States with a correlation coefficient (R) of 0.278 and weighted average of 85.5%. On average, for every 1% (one percent) increase in Immigrants from Oceania within a typical geography, there is an increase of 0.14% in percentage of population with at least ged/equivalency education.
Immigrants from Oceania GED/Equivalency
It is essential to understand that the correlation between the percentage of Immigrants from Oceania and percentage of population with at least ged/equivalency education does not imply a direct cause-and-effect relationship. It remains uncertain whether the presence of Immigrants from Oceania influences an upward or downward trend in the level of percentage of population with at least ged/equivalency education within an area, or if Immigrants from Oceania simply ended up residing in those areas with higher or lower levels of percentage of population with at least ged/equivalency education due to other factors.

Demographics Similar to Immigrants from Oceania by GED/Equivalency

In terms of ged/equivalency, the demographic groups most similar to Immigrants from Oceania are Immigrants from Sudan (85.5%, a difference of 0.010%), Spanish (85.4%, a difference of 0.020%), Sudanese (85.5%, a difference of 0.040%), Spaniard (85.4%, a difference of 0.040%), and Moroccan (85.5%, a difference of 0.090%).
DemographicsRating | RankGED/Equivalency
Immigrants from Uganda
45.2
/100
|
#177
Average
85.7%
Koreans
41.2
/100
|
#178
Average
85.6%
Aleuts
40.5
/100
|
#179
Average
85.6%
Immigrants from Southern Europe
38.4
/100
|
#180
Fair
85.5%
Moroccans
37.7
/100
|
#181
Fair
85.5%
Sudanese
35.2
/100
|
#182
Fair
85.5%
Immigrants from Sudan
34.2
/100
|
#183
Fair
85.5%
Immigrants from Oceania
33.6
/100
|
#184
Fair
85.5%
Spanish
32.8
/100
|
#185
Fair
85.4%
Spaniards
31.9
/100
|
#186
Fair
85.4%
Immigrants from Afghanistan
29.8
/100
|
#187
Fair
85.4%
Immigrants from Sierra Leone
29.0
/100
|
#188
Fair
85.4%
Guamanians/Chamorros
28.4
/100
|
#189
Fair
85.3%
Alaskan Athabascans
27.5
/100
|
#190
Fair
85.3%
South American Indians
22.8
/100
|
#191
Fair
85.2%

Immigrants from Oceania GED/Equivalency Correlation Summary

MeasurementImmigrants from Oceania DataGED/Equivalency Data
Minimum0.11%64.5%
Maximum87.8%100.0%
Range87.7%35.5%
Mean12.1%85.5%
Median8.1%86.1%
Interquartile 25% (IQ1)3.9%82.8%
Interquartile 75% (IQ3)12.6%90.5%
Interquartile Range (IQR)8.7%7.7%
Standard Deviation (Sample)17.0%8.3%
Standard Deviation (Population)16.8%8.2%

Correlation Details

Immigrants from Oceania PercentileSample SizeGED/Equivalency
[
0.0%
-
0.5%
]
0.11%
281,304,22285.6%
[
0.5%
-
1.0%
]
0.60%
14,217,84687.5%
[
1.0%
-
1.5%
]
1.06%
4,771,82487.1%
[
1.0%
-
1.5%
]
1.49%
2,254,40283.8%
[
1.5%
-
2.0%
]
1.97%
825,52185.3%
[
2.0%
-
2.5%
]
2.42%
510,96382.8%
[
2.5%
-
3.0%
]
2.84%
639,44685.8%
[
3.0%
-
3.5%
]
3.36%
184,13183.1%
[
3.5%
-
4.0%
]
3.65%
261,84681.6%
[
4.0%
-
4.5%
]
4.16%
83,39086.1%
[
4.0%
-
4.5%
]
4.50%
81,48086.3%
[
5.0%
-
5.5%
]
5.17%
208,93775.8%
[
5.0%
-
5.5%
]
5.43%
42,81488.8%
[
5.5%
-
6.0%
]
5.89%
4,43388.0%
[
6.0%
-
6.5%
]
6.32%
6,90184.4%
[
6.5%
-
7.0%
]
6.94%
6,15686.8%
[
7.0%
-
7.5%
]
7.12%
63,45568.4%
[
7.5%
-
8.0%
]
7.82%
15,34280.8%
[
8.0%
-
8.5%
]
8.06%
7,39287.9%
[
8.0%
-
8.5%
]
8.45%
5,22168.5%
[
9.0%
-
9.5%
]
9.07%
1,09191.0%
[
9.0%
-
9.5%
]
9.32%
71982.7%
[
9.5%
-
10.0%
]
9.89%
2,17485.3%
[
10.0%
-
10.5%
]
10.25%
4,21493.6%
[
10.5%
-
11.0%
]
10.67%
1,05990.0%
[
11.0%
-
11.5%
]
11.19%
1,85889.3%
[
12.0%
-
12.5%
]
12.26%
21298.0%
[
12.0%
-
12.5%
]
12.33%
7376.7%
[
12.5%
-
13.0%
]
12.94%
7,23693.2%
[
13.0%
-
13.5%
]
13.36%
5,41194.6%
[
13.5%
-
14.0%
]
13.73%
10264.5%
[
14.5%
-
15.0%
]
14.65%
19894.8%
[
18.0%
-
18.5%
]
18.09%
188100.0%
[
18.5%
-
19.0%
]
18.76%
69383.5%
[
32.0%
-
32.5%
]
32.16%
39870.4%
[
65.5%
-
66.0%
]
65.66%
9991.9%
[
87.5%
-
88.0%
]
87.84%
74100.0%