Immigrants from Oceania 2 or more Vehicles in Household

COMPARE

Immigrants from Oceania
Race
Ancestry
AfghanAfricanAlaska NativeAlaskan AthabascanAlbanianAleutAlsatianAmericanApacheArabArapahoArgentineanArmenianAssyrian/Chaldean/SyriacAustralianAustrianBahamianBangladeshiBarbadianBasqueBelgianBelizeanBermudanBhutaneseBlackfeetBolivianBrazilianBritishBritish West IndianBulgarianBurmeseCajunCambodianCanadianCape VerdeanCarpatho RusynCelticCentral AmericanCentral American IndianCherokeeCheyenneChickasawChileanChineseChippewaChoctawColombianColvilleComancheCosta RicanCreeCreekCroatianCrowCubanCypriotCzechCzechoslovakianDanishDelawareDominicanDutchDutch West IndianEastern EuropeanEcuadorianEgyptianEnglishEstonianEthiopianEuropeanFijianFilipinoFinnishFrenchFrench American IndianFrench CanadianGermanGerman RussianGhanaianGreekGuamanian/ChamorroGuatemalanGuyaneseHaitianHmongHonduranHopiHoumaHungarianIcelanderIndian (Asian)IndonesianInupiatIranianIraqiIrishIroquoisIsraeliItalianJamaicanJapaneseJordanianKenyanKiowaKoreanLaotianLatvianLebaneseLiberianLithuanianLumbeeLuxembourgerMacedonianMalaysianMalteseMarshalleseMenomineeMexicanMexican American IndianMongolianMoroccanNative HawaiianNavajoNepaleseNew ZealanderNicaraguanNigerianNorthern EuropeanNorwegianOkinawanOsageOttawaPaiutePakistaniPalestinianPanamanianParaguayanPennsylvania GermanPeruvianPimaPolishPortuguesePotawatomiPuebloPuerto RicanPuget Sound SalishRomanianRussianSalvadoranSamoanScandinavianScotch-IrishScottishSeminoleSenegaleseSerbianShoshoneSierra LeoneanSiouxSlavicSlovakSloveneSomaliSouth AfricanSouth AmericanSouth American IndianSoviet UnionSpaniardSpanishSpanish AmericanSpanish American IndianSri LankanSubsaharan AfricanSudaneseSwedishSwissSyrianTaiwaneseThaiTlingit-HaidaTohono O'OdhamTonganTrinidadian and TobagonianTsimshianTurkishU.S. Virgin IslanderUgandanUkrainianUruguayanUteVenezuelanVietnameseWelshWest IndianYakamaYaquiYugoslavianYumanYup'ikZimbabwean
Immigration
NonimmigrantsImmigrantsAfghanistanAfricaAlbaniaArgentinaArmeniaAsiaAustraliaAustriaBahamasBangladeshBarbadosBelarusBelgiumBelizeBoliviaBosnia and HerzegovinaBrazilBulgariaBurma/MyanmarCabo VerdeCambodiaCameroonCanadaCaribbeanCentral AmericaChileChinaColombiaCongoCosta RicaCroatiaCubaCzechoslovakiaDenmarkDominicaDominican RepublicEastern AfricaEastern AsiaEastern EuropeEcuadorEgyptEl SalvadorEnglandEritreaEthiopiaEuropeFijiFranceGermanyGhanaGreeceGrenadaGuatemalaGuyanaHaitiHondurasHong KongHungaryIndiaIndonesiaIranIraqIrelandIsraelItalyJamaicaJapanJordanKazakhstanKenyaKoreaKuwaitLaosLatin AmericaLatviaLebanonLiberiaLithuaniaMalaysiaMexicoMicronesiaMiddle AfricaMoldovaMoroccoNepalNetherlandsNicaraguaNigeriaNorth AmericaNorth MacedoniaNorthern AfricaNorthern EuropeNorwayOceaniaPakistanPanamaPeruPhilippinesPolandPortugalRomaniaRussiaSaudi ArabiaScotlandSenegalSerbiaSierra LeoneSingaporeSomaliaSouth AfricaSouth AmericaSouth Central AsiaSouth Eastern AsiaSouthern EuropeSpainSri LankaSt. Vincent and the GrenadinesSudanSwedenSwitzerlandSyriaTaiwanThailandTrinidad and TobagoTurkeyUgandaUkraineUruguayUzbekistanVenezuelaVietnamWest IndiesWestern AfricaWestern AsiaWestern EuropeYemenZaireZimbabweAzores
Select to Compare
Race
Ancestry
AfghanAfricanAlaska NativeAlaskan AthabascanAlbanianAleutAlsatianAmericanApacheArabArapahoArgentineanArmenianAssyrian/Chaldean/SyriacAustralianAustrianBahamianBangladeshiBarbadianBasqueBelgianBelizeanBermudanBhutaneseBlackfeetBolivianBrazilianBritishBritish West IndianBulgarianBurmeseCajunCambodianCanadianCape VerdeanCarpatho RusynCelticCentral AmericanCentral American IndianCherokeeCheyenneChickasawChileanChineseChippewaChoctawColombianColvilleComancheCosta RicanCreeCreekCroatianCrowCubanCypriotCzechCzechoslovakianDanishDelawareDominicanDutchDutch West IndianEastern EuropeanEcuadorianEgyptianEnglishEstonianEthiopianEuropeanFijianFilipinoFinnishFrenchFrench American IndianFrench CanadianGermanGerman RussianGhanaianGreekGuamanian/ChamorroGuatemalanGuyaneseHaitianHmongHonduranHopiHoumaHungarianIcelanderIndian (Asian)IndonesianInupiatIranianIraqiIrishIroquoisIsraeliItalianJamaicanJapaneseJordanianKenyanKiowaKoreanLaotianLatvianLebaneseLiberianLithuanianLumbeeLuxembourgerMacedonianMalaysianMalteseMarshalleseMenomineeMexicanMexican American IndianMongolianMoroccanNative HawaiianNavajoNepaleseNew ZealanderNicaraguanNigerianNorthern EuropeanNorwegianOkinawanOsageOttawaPaiutePakistaniPalestinianPanamanianParaguayanPennsylvania GermanPeruvianPimaPolishPortuguesePotawatomiPuebloPuerto RicanPuget Sound SalishRomanianRussianSalvadoranSamoanScandinavianScotch-IrishScottishSeminoleSenegaleseSerbianShoshoneSierra LeoneanSiouxSlavicSlovakSloveneSomaliSouth AfricanSouth AmericanSouth American IndianSoviet UnionSpaniardSpanishSpanish AmericanSpanish American IndianSri LankanSubsaharan AfricanSudaneseSwedishSwissSyrianTaiwaneseThaiTlingit-HaidaTohono O'OdhamTonganTrinidadian and TobagonianTsimshianTurkishU.S. Virgin IslanderUgandanUkrainianUruguayanUteVenezuelanVietnameseWelshWest IndianYakamaYaquiYugoslavianYumanYup'ikZimbabwean
Immigration
NonimmigrantsImmigrantsAfghanistanAfricaAlbaniaArgentinaArmeniaAsiaAustraliaAustriaBahamasBangladeshBarbadosBelarusBelgiumBelizeBoliviaBosnia and HerzegovinaBrazilBulgariaBurma/MyanmarCabo VerdeCambodiaCameroonCanadaCaribbeanCentral AmericaChileChinaColombiaCongoCosta RicaCroatiaCubaCzechoslovakiaDenmarkDominicaDominican RepublicEastern AfricaEastern AsiaEastern EuropeEcuadorEgyptEl SalvadorEnglandEritreaEthiopiaEuropeFijiFranceGermanyGhanaGreeceGrenadaGuatemalaGuyanaHaitiHondurasHong KongHungaryIndiaIndonesiaIranIraqIrelandIsraelItalyJamaicaJapanJordanKazakhstanKenyaKoreaKuwaitLaosLatin AmericaLatviaLebanonLiberiaLithuaniaMalaysiaMexicoMicronesiaMiddle AfricaMoldovaMoroccoNepalNetherlandsNicaraguaNigeriaNorth AmericaNorth MacedoniaNorthern AfricaNorthern EuropeNorwayPakistanPanamaPeruPhilippinesPolandPortugalRomaniaRussiaSaudi ArabiaScotlandSenegalSerbiaSierra LeoneSingaporeSomaliaSouth AfricaSouth AmericaSouth Central AsiaSouth Eastern AsiaSouthern EuropeSpainSri LankaSt. Vincent and the GrenadinesSudanSwedenSwitzerlandSyriaTaiwanThailandTrinidad and TobagoTurkeyUgandaUkraineUruguayUzbekistanVenezuelaVietnamWest IndiesWestern AfricaWestern AsiaWestern EuropeYemenZaireZimbabweAzores
2 or more Vehicles in Household
Income
Poverty
Unemployment
Labor Participation
Family Structure
Vehicle Availability
Education Level
Disability

Immigrants from Oceania 2 or more Vehicles in Household
Exceptional

57.5%
2+ VEHICLES AVAILABLE
98.2/ 100
METRIC RATING
106th/ 347
METRIC RANK

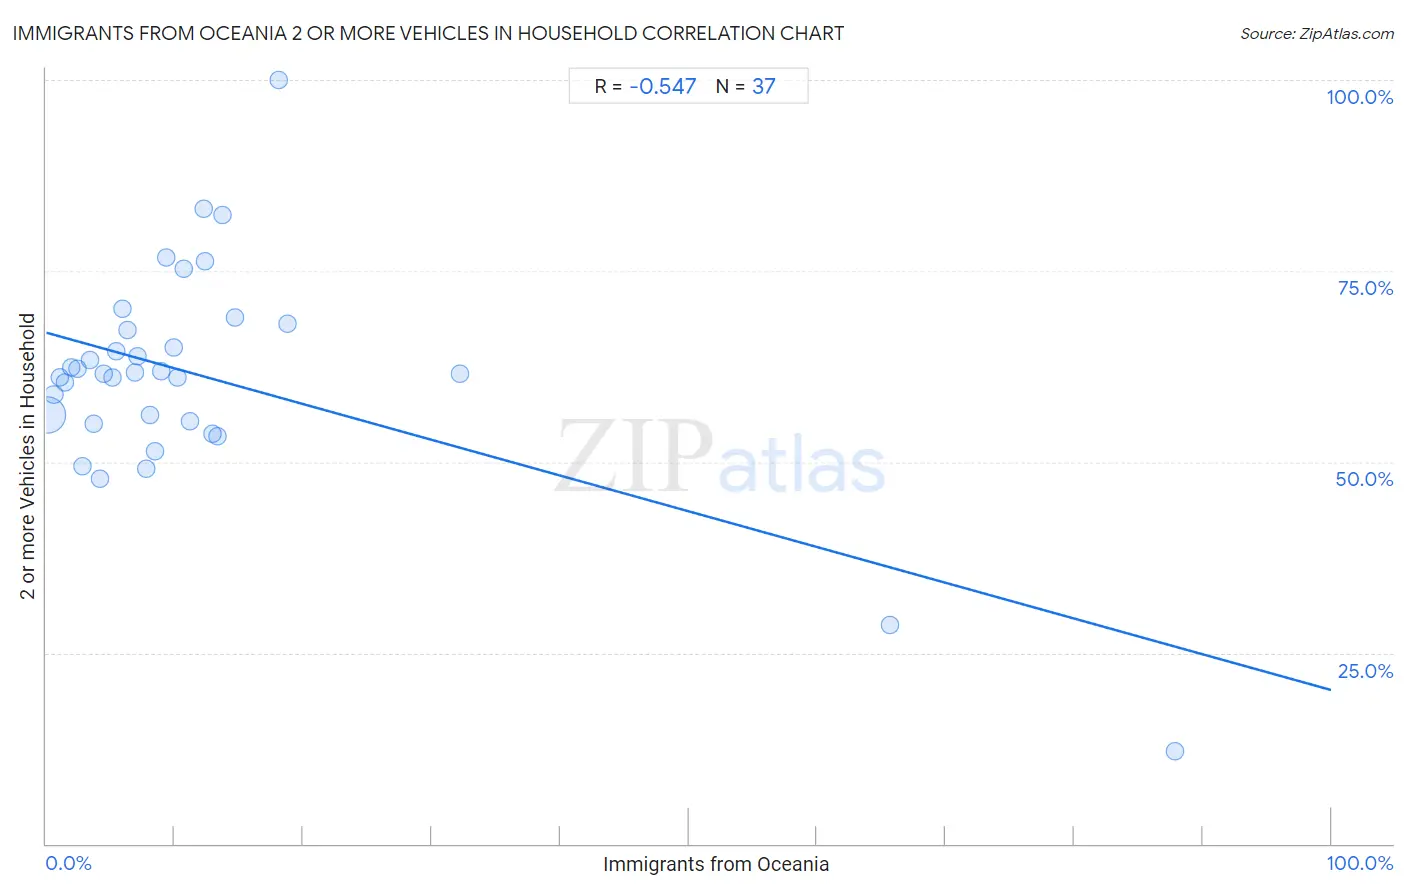
Immigrants from Oceania 2 or more Vehicles in Household Correlation Chart

The statistical analysis conducted on geographies consisting of 305,385,157 people shows a substantial negative correlation between the proportion of Immigrants from Oceania and percentage of households with 2 or more vehicles available in the United States with a correlation coefficient (R) of -0.547 and weighted average of 57.5%. On average, for every 1% (one percent) increase in Immigrants from Oceania within a typical geography, there is a decrease of 0.47% in percentage of households with 2 or more vehicles available.
Immigrants from Oceania 2 or more Vehicles in Household
It is essential to understand that the correlation between the percentage of Immigrants from Oceania and percentage of households with 2 or more vehicles available does not imply a direct cause-and-effect relationship. It remains uncertain whether the presence of Immigrants from Oceania influences an upward or downward trend in the level of percentage of households with 2 or more vehicles available within an area, or if Immigrants from Oceania simply ended up residing in those areas with higher or lower levels of percentage of households with 2 or more vehicles available due to other factors.

Demographics Similar to Immigrants from Oceania by 2 or more Vehicles in Household

In terms of 2 or more vehicles in household, the demographic groups most similar to Immigrants from Oceania are Immigrants from Bolivia (57.6%, a difference of 0.020%), Jordanian (57.6%, a difference of 0.020%), Immigrants from Indonesia (57.6%, a difference of 0.020%), Immigrants from Korea (57.6%, a difference of 0.020%), and Immigrants from Netherlands (57.5%, a difference of 0.020%).
DemographicsRating | Rank2 or more Vehicles in Household
Cajuns
98.5
/100
|
#99
Exceptional
57.7%
Fijians
98.4
/100
|
#100
Exceptional
57.6%
Lebanese
98.3
/100
|
#101
Exceptional
57.6%
Immigrants from Bolivia
98.2
/100
|
#102
Exceptional
57.6%
Jordanians
98.2
/100
|
#103
Exceptional
57.6%
Immigrants from Indonesia
98.2
/100
|
#104
Exceptional
57.6%
Immigrants from Korea
98.2
/100
|
#105
Exceptional
57.6%
Immigrants from Oceania
98.2
/100
|
#106
Exceptional
57.5%
Immigrants from Netherlands
98.2
/100
|
#107
Exceptional
57.5%
Immigrants from Canada
98.1
/100
|
#108
Exceptional
57.5%
Immigrants from North America
98.1
/100
|
#109
Exceptional
57.5%
Japanese
98.0
/100
|
#110
Exceptional
57.5%
Greeks
98.0
/100
|
#111
Exceptional
57.5%
Pueblo
98.0
/100
|
#112
Exceptional
57.5%
Zimbabweans
96.9
/100
|
#113
Exceptional
57.2%

Immigrants from Oceania 2 or more Vehicles in Household Correlation Summary

MeasurementImmigrants from Oceania Data2 or more Vehicles in Household Data
Minimum0.11%12.2%
Maximum87.8%100.0%
Range87.7%87.8%
Mean12.1%61.2%
Median8.1%61.5%
Interquartile 25% (IQ1)3.9%55.1%
Interquartile 75% (IQ3)12.6%67.7%
Interquartile Range (IQR)8.7%12.5%
Standard Deviation (Sample)17.0%14.6%
Standard Deviation (Population)16.8%14.4%

Correlation Details

Immigrants from Oceania PercentileSample Size2 or more Vehicles in Household
[
0.0%
-
0.5%
]
0.11%
281,206,82456.1%
[
0.5%
-
1.0%
]
0.60%
14,196,92258.8%
[
1.0%
-
1.5%
]
1.06%
4,767,15661.0%
[
1.0%
-
1.5%
]
1.49%
2,246,73760.4%
[
1.5%
-
2.0%
]
1.97%
824,96162.4%
[
2.0%
-
2.5%
]
2.42%
510,96362.3%
[
2.5%
-
3.0%
]
2.84%
636,16549.4%
[
3.0%
-
3.5%
]
3.36%
184,13163.3%
[
3.5%
-
4.0%
]
3.65%
261,84654.9%
[
4.0%
-
4.5%
]
4.16%
83,22747.7%
[
4.0%
-
4.5%
]
4.50%
81,30361.5%
[
5.0%
-
5.5%
]
5.17%
208,93761.0%
[
5.0%
-
5.5%
]
5.43%
42,81464.5%
[
5.5%
-
6.0%
]
5.89%
4,43370.1%
[
6.0%
-
6.5%
]
6.32%
6,90167.2%
[
6.5%
-
7.0%
]
6.93%
5,91461.7%
[
7.0%
-
7.5%
]
7.12%
63,45563.9%
[
7.5%
-
8.0%
]
7.82%
15,34249.0%
[
8.0%
-
8.5%
]
8.06%
6,60256.1%
[
8.0%
-
8.5%
]
8.45%
5,22151.4%
[
8.5%
-
9.0%
]
8.97%
62461.8%
[
9.0%
-
9.5%
]
9.32%
71976.8%
[
9.5%
-
10.0%
]
9.89%
2,17464.9%
[
10.0%
-
10.5%
]
10.25%
4,18561.0%
[
10.5%
-
11.0%
]
10.67%
1,05975.2%
[
11.0%
-
11.5%
]
11.19%
1,85855.4%
[
12.0%
-
12.5%
]
12.26%
21283.2%
[
12.0%
-
12.5%
]
12.33%
7376.3%
[
12.5%
-
13.0%
]
12.94%
7,23653.7%
[
13.0%
-
13.5%
]
13.36%
5,41153.3%
[
13.5%
-
14.0%
]
13.73%
10282.4%
[
14.5%
-
15.0%
]
14.65%
19869.0%
[
18.0%
-
18.5%
]
18.09%
188100.0%
[
18.5%
-
19.0%
]
18.76%
69368.1%
[
32.0%
-
32.5%
]
32.16%
39861.5%
[
65.5%
-
66.0%
]
65.66%
9928.6%
[
87.5%
-
88.0%
]
87.84%
7412.2%