Immigrants from Oceania Married-couple Households

COMPARE

Immigrants from Oceania
Race
Ancestry
AfghanAfricanAlaska NativeAlaskan AthabascanAlbanianAleutAlsatianAmericanApacheArabArapahoArgentineanArmenianAssyrian/Chaldean/SyriacAustralianAustrianBahamianBangladeshiBarbadianBasqueBelgianBelizeanBermudanBhutaneseBlackfeetBolivianBrazilianBritishBritish West IndianBulgarianBurmeseCajunCambodianCanadianCape VerdeanCarpatho RusynCelticCentral AmericanCentral American IndianCherokeeCheyenneChickasawChileanChineseChippewaChoctawColombianColvilleComancheCosta RicanCreeCreekCroatianCrowCubanCypriotCzechCzechoslovakianDanishDelawareDominicanDutchDutch West IndianEastern EuropeanEcuadorianEgyptianEnglishEstonianEthiopianEuropeanFijianFilipinoFinnishFrenchFrench American IndianFrench CanadianGermanGerman RussianGhanaianGreekGuamanian/ChamorroGuatemalanGuyaneseHaitianHmongHonduranHopiHoumaHungarianIcelanderIndian (Asian)IndonesianInupiatIranianIraqiIrishIroquoisIsraeliItalianJamaicanJapaneseJordanianKenyanKiowaKoreanLaotianLatvianLebaneseLiberianLithuanianLumbeeLuxembourgerMacedonianMalaysianMalteseMarshalleseMenomineeMexicanMexican American IndianMongolianMoroccanNative HawaiianNavajoNepaleseNew ZealanderNicaraguanNigerianNorthern EuropeanNorwegianOkinawanOsageOttawaPaiutePakistaniPalestinianPanamanianParaguayanPennsylvania GermanPeruvianPimaPolishPortuguesePotawatomiPuebloPuerto RicanPuget Sound SalishRomanianRussianSalvadoranSamoanScandinavianScotch-IrishScottishSeminoleSenegaleseSerbianShoshoneSierra LeoneanSiouxSlavicSlovakSloveneSomaliSouth AfricanSouth AmericanSouth American IndianSoviet UnionSpaniardSpanishSpanish AmericanSpanish American IndianSri LankanSubsaharan AfricanSudaneseSwedishSwissSyrianTaiwaneseThaiTlingit-HaidaTohono O'OdhamTonganTrinidadian and TobagonianTsimshianTurkishU.S. Virgin IslanderUgandanUkrainianUruguayanUteVenezuelanVietnameseWelshWest IndianYakamaYaquiYugoslavianYumanYup'ikZimbabwean
Immigration
NonimmigrantsImmigrantsAfghanistanAfricaAlbaniaArgentinaArmeniaAsiaAustraliaAustriaBahamasBangladeshBarbadosBelarusBelgiumBelizeBoliviaBosnia and HerzegovinaBrazilBulgariaBurma/MyanmarCabo VerdeCambodiaCameroonCanadaCaribbeanCentral AmericaChileChinaColombiaCongoCosta RicaCroatiaCubaCzechoslovakiaDenmarkDominicaDominican RepublicEastern AfricaEastern AsiaEastern EuropeEcuadorEgyptEl SalvadorEnglandEritreaEthiopiaEuropeFijiFranceGermanyGhanaGreeceGrenadaGuatemalaGuyanaHaitiHondurasHong KongHungaryIndiaIndonesiaIranIraqIrelandIsraelItalyJamaicaJapanJordanKazakhstanKenyaKoreaKuwaitLaosLatin AmericaLatviaLebanonLiberiaLithuaniaMalaysiaMexicoMicronesiaMiddle AfricaMoldovaMoroccoNepalNetherlandsNicaraguaNigeriaNorth AmericaNorth MacedoniaNorthern AfricaNorthern EuropeNorwayOceaniaPakistanPanamaPeruPhilippinesPolandPortugalRomaniaRussiaSaudi ArabiaScotlandSenegalSerbiaSierra LeoneSingaporeSomaliaSouth AfricaSouth AmericaSouth Central AsiaSouth Eastern AsiaSouthern EuropeSpainSri LankaSt. Vincent and the GrenadinesSudanSwedenSwitzerlandSyriaTaiwanThailandTrinidad and TobagoTurkeyUgandaUkraineUruguayUzbekistanVenezuelaVietnamWest IndiesWestern AfricaWestern AsiaWestern EuropeYemenZaireZimbabweAzores
Select to Compare
Race
Ancestry
AfghanAfricanAlaska NativeAlaskan AthabascanAlbanianAleutAlsatianAmericanApacheArabArapahoArgentineanArmenianAssyrian/Chaldean/SyriacAustralianAustrianBahamianBangladeshiBarbadianBasqueBelgianBelizeanBermudanBhutaneseBlackfeetBolivianBrazilianBritishBritish West IndianBulgarianBurmeseCajunCambodianCanadianCape VerdeanCarpatho RusynCelticCentral AmericanCentral American IndianCherokeeCheyenneChickasawChileanChineseChippewaChoctawColombianColvilleComancheCosta RicanCreeCreekCroatianCrowCubanCypriotCzechCzechoslovakianDanishDelawareDominicanDutchDutch West IndianEastern EuropeanEcuadorianEgyptianEnglishEstonianEthiopianEuropeanFijianFilipinoFinnishFrenchFrench American IndianFrench CanadianGermanGerman RussianGhanaianGreekGuamanian/ChamorroGuatemalanGuyaneseHaitianHmongHonduranHopiHoumaHungarianIcelanderIndian (Asian)IndonesianInupiatIranianIraqiIrishIroquoisIsraeliItalianJamaicanJapaneseJordanianKenyanKiowaKoreanLaotianLatvianLebaneseLiberianLithuanianLumbeeLuxembourgerMacedonianMalaysianMalteseMarshalleseMenomineeMexicanMexican American IndianMongolianMoroccanNative HawaiianNavajoNepaleseNew ZealanderNicaraguanNigerianNorthern EuropeanNorwegianOkinawanOsageOttawaPaiutePakistaniPalestinianPanamanianParaguayanPennsylvania GermanPeruvianPimaPolishPortuguesePotawatomiPuebloPuerto RicanPuget Sound SalishRomanianRussianSalvadoranSamoanScandinavianScotch-IrishScottishSeminoleSenegaleseSerbianShoshoneSierra LeoneanSiouxSlavicSlovakSloveneSomaliSouth AfricanSouth AmericanSouth American IndianSoviet UnionSpaniardSpanishSpanish AmericanSpanish American IndianSri LankanSubsaharan AfricanSudaneseSwedishSwissSyrianTaiwaneseThaiTlingit-HaidaTohono O'OdhamTonganTrinidadian and TobagonianTsimshianTurkishU.S. Virgin IslanderUgandanUkrainianUruguayanUteVenezuelanVietnameseWelshWest IndianYakamaYaquiYugoslavianYumanYup'ikZimbabwean
Immigration
NonimmigrantsImmigrantsAfghanistanAfricaAlbaniaArgentinaArmeniaAsiaAustraliaAustriaBahamasBangladeshBarbadosBelarusBelgiumBelizeBoliviaBosnia and HerzegovinaBrazilBulgariaBurma/MyanmarCabo VerdeCambodiaCameroonCanadaCaribbeanCentral AmericaChileChinaColombiaCongoCosta RicaCroatiaCubaCzechoslovakiaDenmarkDominicaDominican RepublicEastern AfricaEastern AsiaEastern EuropeEcuadorEgyptEl SalvadorEnglandEritreaEthiopiaEuropeFijiFranceGermanyGhanaGreeceGrenadaGuatemalaGuyanaHaitiHondurasHong KongHungaryIndiaIndonesiaIranIraqIrelandIsraelItalyJamaicaJapanJordanKazakhstanKenyaKoreaKuwaitLaosLatin AmericaLatviaLebanonLiberiaLithuaniaMalaysiaMexicoMicronesiaMiddle AfricaMoldovaMoroccoNepalNetherlandsNicaraguaNigeriaNorth AmericaNorth MacedoniaNorthern AfricaNorthern EuropeNorwayPakistanPanamaPeruPhilippinesPolandPortugalRomaniaRussiaSaudi ArabiaScotlandSenegalSerbiaSierra LeoneSingaporeSomaliaSouth AfricaSouth AmericaSouth Central AsiaSouth Eastern AsiaSouthern EuropeSpainSri LankaSt. Vincent and the GrenadinesSudanSwedenSwitzerlandSyriaTaiwanThailandTrinidad and TobagoTurkeyUgandaUkraineUruguayUzbekistanVenezuelaVietnamWest IndiesWestern AfricaWestern AsiaWestern EuropeYemenZaireZimbabweAzores
Married-couple Households
Income
Poverty
Unemployment
Labor Participation
Family Structure
Vehicle Availability
Education Level
Disability

Immigrants from Oceania Married-couple Households
Good

46.9%
MARRIED-COUPLE HOUSEHOLDS
74.8/ 100
METRIC RATING
157th/ 347
METRIC RANK

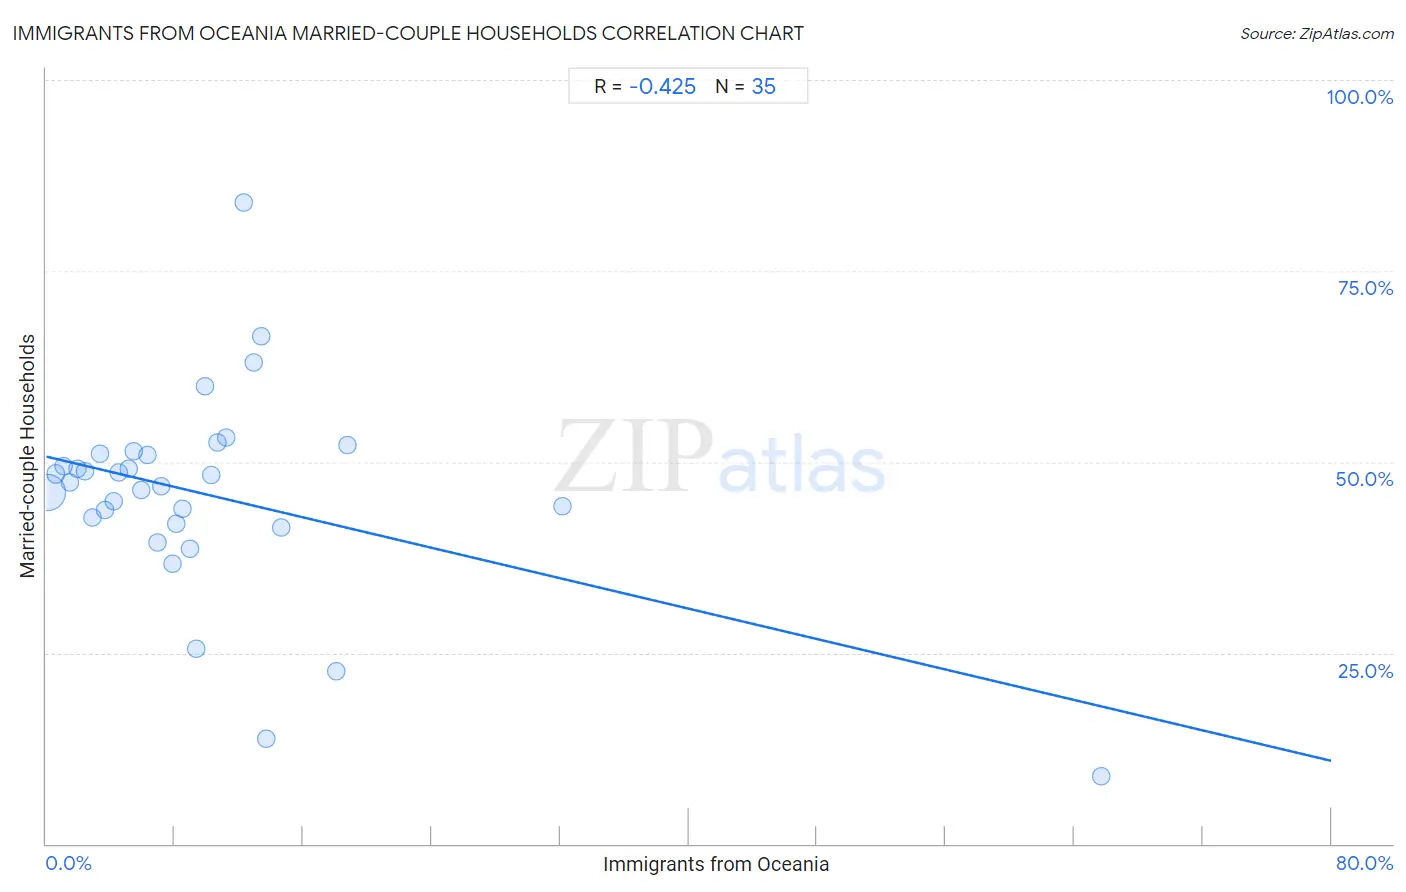
Immigrants from Oceania Married-couple Households Correlation Chart

The statistical analysis conducted on geographies consisting of 305,387,032 people shows a moderate negative correlation between the proportion of Immigrants from Oceania and percentage of married-couple family households in the United States with a correlation coefficient (R) of -0.425 and weighted average of 46.9%. On average, for every 1% (one percent) increase in Immigrants from Oceania within a typical geography, there is a decrease of 0.50% in percentage of married-couple family households.
Immigrants from Oceania Married-couple Households
It is essential to understand that the correlation between the percentage of Immigrants from Oceania and percentage of married-couple family households does not imply a direct cause-and-effect relationship. It remains uncertain whether the presence of Immigrants from Oceania influences an upward or downward trend in the level of percentage of married-couple family households within an area, or if Immigrants from Oceania simply ended up residing in those areas with higher or lower levels of percentage of married-couple family households due to other factors.

Demographics Similar to Immigrants from Oceania by Married-couple Households

In terms of married-couple households, the demographic groups most similar to Immigrants from Oceania are Armenian (46.9%, a difference of 0.030%), Immigrants from Western Asia (46.9%, a difference of 0.060%), Arab (46.9%, a difference of 0.060%), Hmong (47.0%, a difference of 0.070%), and Serbian (47.0%, a difference of 0.080%).
DemographicsRating | RankMarried-couple Households
Immigrants from Russia
77.6
/100
|
#150
Good
47.0%
Immigrants from Bulgaria
76.8
/100
|
#151
Good
47.0%
Serbians
76.3
/100
|
#152
Good
47.0%
Hmong
76.2
/100
|
#153
Good
47.0%
Immigrants from Western Asia
76.1
/100
|
#154
Good
46.9%
Arabs
76.0
/100
|
#155
Good
46.9%
Armenians
75.4
/100
|
#156
Good
46.9%
Immigrants from Oceania
74.8
/100
|
#157
Good
46.9%
Nonimmigrants
73.3
/100
|
#158
Good
46.9%
Osage
73.2
/100
|
#159
Good
46.9%
Iraqis
71.7
/100
|
#160
Good
46.9%
Delaware
71.2
/100
|
#161
Good
46.8%
Colombians
71.0
/100
|
#162
Good
46.8%
Immigrants from Turkey
70.2
/100
|
#163
Good
46.8%
Immigrants from Kazakhstan
70.0
/100
|
#164
Good
46.8%

Immigrants from Oceania Married-couple Households Correlation Summary

MeasurementImmigrants from Oceania DataMarried-couple Households Data
Minimum0.11%8.8%
Maximum65.7%84.0%
Range65.6%75.2%
Mean10.0%45.7%
Median7.8%47.2%
Interquartile 25% (IQ1)3.6%41.9%
Interquartile 75% (IQ3)12.3%51.1%
Interquartile Range (IQR)8.6%9.2%
Standard Deviation (Sample)11.6%13.6%
Standard Deviation (Population)11.4%13.4%

Correlation Details

Immigrants from Oceania PercentileSample SizeMarried-couple Households
[
0.0%
-
0.5%
]
0.11%
281,207,21245.9%
[
0.5%
-
1.0%
]
0.60%
14,196,24248.4%
[
1.0%
-
1.5%
]
1.06%
4,767,15649.5%
[
1.0%
-
1.5%
]
1.49%
2,249,42547.2%
[
1.5%
-
2.0%
]
1.97%
824,96149.2%
[
2.0%
-
2.5%
]
2.42%
510,96348.8%
[
2.5%
-
3.0%
]
2.84%
636,16542.8%
[
3.0%
-
3.5%
]
3.36%
184,13151.1%
[
3.5%
-
4.0%
]
3.65%
261,84643.7%
[
4.0%
-
4.5%
]
4.16%
83,22744.8%
[
4.0%
-
4.5%
]
4.50%
81,30348.6%
[
5.0%
-
5.5%
]
5.17%
208,93749.1%
[
5.0%
-
5.5%
]
5.43%
42,81451.3%
[
5.5%
-
6.0%
]
5.89%
4,43346.3%
[
6.0%
-
6.5%
]
6.32%
6,90150.9%
[
6.5%
-
7.0%
]
6.93%
5,91439.5%
[
7.0%
-
7.5%
]
7.12%
63,45546.8%
[
7.5%
-
8.0%
]
7.82%
15,34236.6%
[
8.0%
-
8.5%
]
8.06%
6,60241.9%
[
8.0%
-
8.5%
]
8.45%
5,22143.8%
[
8.5%
-
9.0%
]
8.97%
62438.6%
[
9.0%
-
9.5%
]
9.32%
71925.5%
[
9.5%
-
10.0%
]
9.89%
2,17459.9%
[
10.0%
-
10.5%
]
10.25%
4,18548.3%
[
10.5%
-
11.0%
]
10.66%
68552.5%
[
11.0%
-
11.5%
]
11.19%
1,85853.2%
[
12.0%
-
12.5%
]
12.26%
21284.0%
[
12.5%
-
13.0%
]
12.94%
7,23663.0%
[
13.0%
-
13.5%
]
13.36%
5,41166.5%
[
13.5%
-
14.0%
]
13.73%
10213.7%
[
14.5%
-
15.0%
]
14.65%
19841.4%
[
18.0%
-
18.5%
]
18.09%
18822.7%
[
18.5%
-
19.0%
]
18.76%
69352.2%
[
32.0%
-
32.5%
]
32.16%
39844.3%
[
65.5%
-
66.0%
]
65.66%
998.8%