Immigrants from Oceania Self-Care Disability
COMPARE
Immigrants from Oceania
Select to Compare
Self-Care Disability
Immigrants from Oceania Self-Care Disability
2.5%
SELF-CARE DISABILITY
28.3/ 100
METRIC RATING
188th/ 347
METRIC RANK
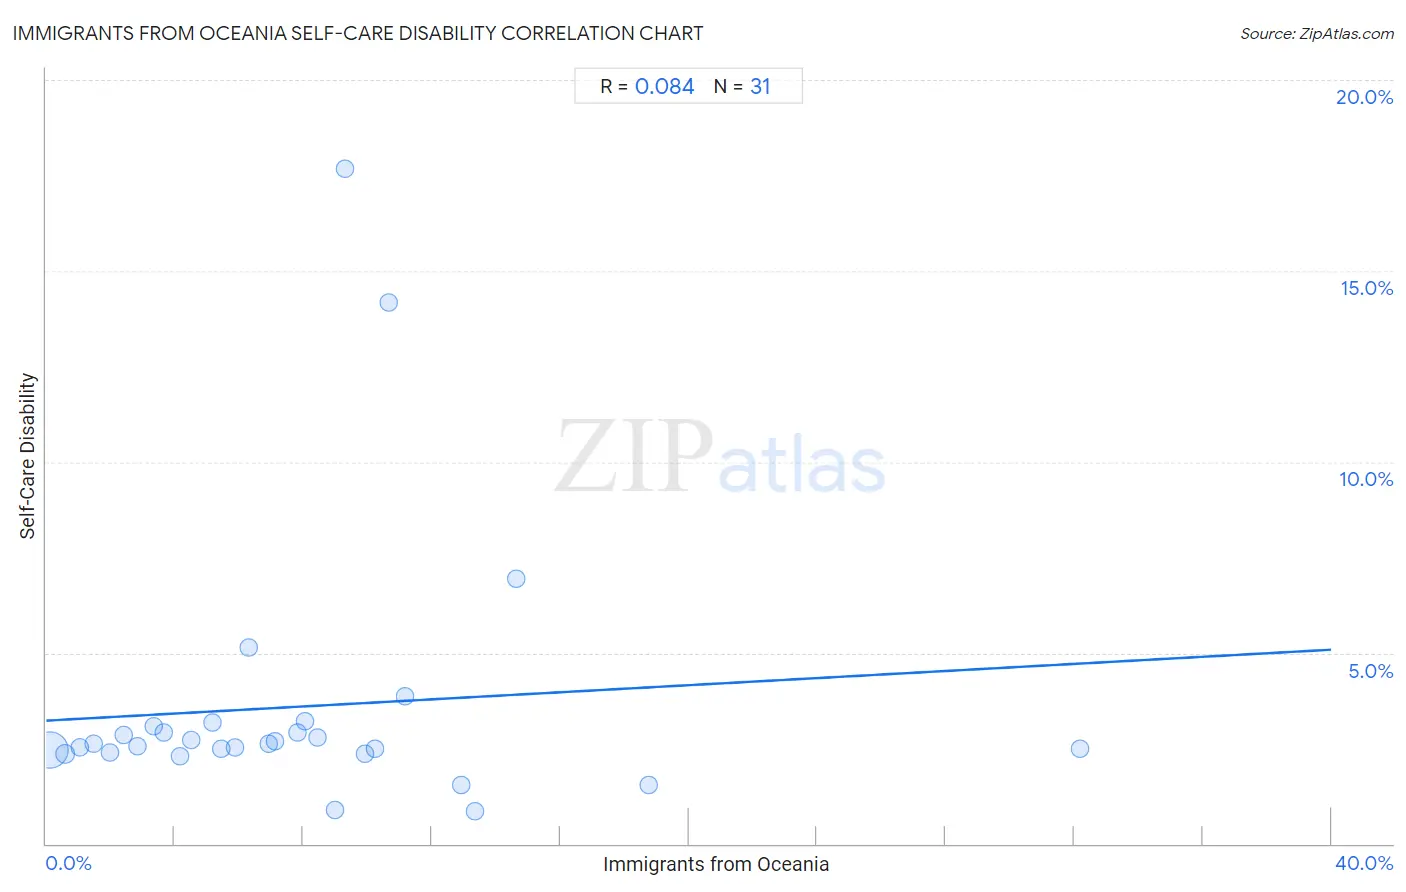
Immigrants from Oceania Self-Care Disability Correlation Chart
The statistical analysis conducted on geographies consisting of 305,144,146 people shows a slight positive correlation between the proportion of Immigrants from Oceania and percentage of population with self-care disability in the United States with a correlation coefficient (R) of 0.084 and weighted average of 2.5%. On average, for every 1% (one percent) increase in Immigrants from Oceania within a typical geography, there is an increase of 0.046% in percentage of population with self-care disability.
It is essential to understand that the correlation between the percentage of Immigrants from Oceania and percentage of population with self-care disability does not imply a direct cause-and-effect relationship. It remains uncertain whether the presence of Immigrants from Oceania influences an upward or downward trend in the level of percentage of population with self-care disability within an area, or if Immigrants from Oceania simply ended up residing in those areas with higher or lower levels of percentage of population with self-care disability due to other factors.
Demographics Similar to Immigrants from Oceania by Self-Care Disability
In terms of self-care disability, the demographic groups most similar to Immigrants from Oceania are Immigrants from Eastern Europe (2.5%, a difference of 0.010%), Irish (2.5%, a difference of 0.030%), Sioux (2.5%, a difference of 0.22%), Immigrants from El Salvador (2.5%, a difference of 0.26%), and Slavic (2.5%, a difference of 0.33%).
| Demographics | Rating | Rank | Self-Care Disability |
| Ghanaians | 40.4 /100 | #181 | Average 2.5% |
| Maltese | 37.5 /100 | #182 | Fair 2.5% |
| Salvadorans | 36.4 /100 | #183 | Fair 2.5% |
| Yugoslavians | 36.1 /100 | #184 | Fair 2.5% |
| Slavs | 34.3 /100 | #185 | Fair 2.5% |
| Immigrants from El Salvador | 33.0 /100 | #186 | Fair 2.5% |
| Irish | 28.7 /100 | #187 | Fair 2.5% |
| Immigrants from Oceania | 28.3 /100 | #188 | Fair 2.5% |
| Immigrants from Eastern Europe | 28.0 /100 | #189 | Fair 2.5% |
| Sioux | 24.6 /100 | #190 | Fair 2.5% |
| Moroccans | 22.9 /100 | #191 | Fair 2.5% |
| Soviet Union | 22.2 /100 | #192 | Fair 2.5% |
| Ukrainians | 21.4 /100 | #193 | Fair 2.5% |
| Immigrants from Germany | 17.9 /100 | #194 | Poor 2.5% |
| Immigrants from Southern Europe | 15.6 /100 | #195 | Poor 2.5% |
Immigrants from Oceania Self-Care Disability Correlation Summary
| Measurement | Immigrants from Oceania Data | Self-Care Disability Data |
| Minimum | 0.11% | 0.86% |
| Maximum | 32.2% | 17.7% |
| Range | 32.1% | 16.8% |
| Mean | 7.7% | 3.6% |
| Median | 6.9% | 2.6% |
| Interquartile 25% (IQ1) | 3.4% | 2.4% |
| Interquartile 75% (IQ3) | 10.3% | 3.1% |
| Interquartile Range (IQR) | 6.9% | 0.68% |
| Standard Deviation (Sample) | 6.4% | 3.5% |
| Standard Deviation (Population) | 6.3% | 3.4% |
Correlation Details
| Immigrants from Oceania Percentile | Sample Size | Self-Care Disability |
[ 0.0% - 0.5% ] 0.11% | 281,063,420 | 2.4% |
[ 0.5% - 1.0% ] 0.60% | 14,155,092 | 2.4% |
[ 1.0% - 1.5% ] 1.06% | 4,748,844 | 2.5% |
[ 1.0% - 1.5% ] 1.49% | 2,244,841 | 2.6% |
[ 1.5% - 2.0% ] 1.97% | 807,482 | 2.4% |
[ 2.0% - 2.5% ] 2.42% | 506,427 | 2.8% |
[ 2.5% - 3.0% ] 2.84% | 632,611 | 2.6% |
[ 3.0% - 3.5% ] 3.36% | 182,823 | 3.1% |
[ 3.5% - 4.0% ] 3.65% | 260,252 | 2.9% |
[ 4.0% - 4.5% ] 4.16% | 82,926 | 2.3% |
[ 4.0% - 4.5% ] 4.49% | 79,073 | 2.7% |
[ 5.0% - 5.5% ] 5.17% | 208,627 | 3.2% |
[ 5.0% - 5.5% ] 5.43% | 41,982 | 2.5% |
[ 5.5% - 6.0% ] 5.89% | 4,140 | 2.5% |
[ 6.0% - 6.5% ] 6.31% | 6,545 | 5.1% |
[ 6.5% - 7.0% ] 6.93% | 5,713 | 2.6% |
[ 7.0% - 7.5% ] 7.12% | 63,095 | 2.7% |
[ 7.5% - 8.0% ] 7.82% | 15,342 | 2.9% |
[ 8.0% - 8.5% ] 8.04% | 5,650 | 3.2% |
[ 8.0% - 8.5% ] 8.45% | 5,221 | 2.8% |
[ 8.5% - 9.0% ] 8.97% | 624 | 0.89% |
[ 9.0% - 9.5% ] 9.32% | 719 | 17.7% |
[ 9.5% - 10.0% ] 9.93% | 1,843 | 2.4% |
[ 10.0% - 10.5% ] 10.25% | 4,185 | 2.5% |
[ 10.5% - 11.0% ] 10.67% | 1,059 | 14.2% |
[ 11.0% - 11.5% ] 11.17% | 1,674 | 3.9% |
[ 12.5% - 13.0% ] 12.94% | 7,236 | 1.5% |
[ 13.0% - 13.5% ] 13.36% | 5,411 | 0.86% |
[ 14.5% - 15.0% ] 14.65% | 198 | 7.0% |
[ 18.5% - 19.0% ] 18.76% | 693 | 1.5% |
[ 32.0% - 32.5% ] 32.16% | 398 | 2.5% |