Immigrants from Malaysia Wage/Income Gap
COMPARE
Immigrants from Malaysia
Select to Compare
Wage/Income Gap
Immigrants from Malaysia Wage/Income Gap
26.3%
WAGE/INCOME GAP
22.2/ 100
METRIC RATING
195th/ 347
METRIC RANK
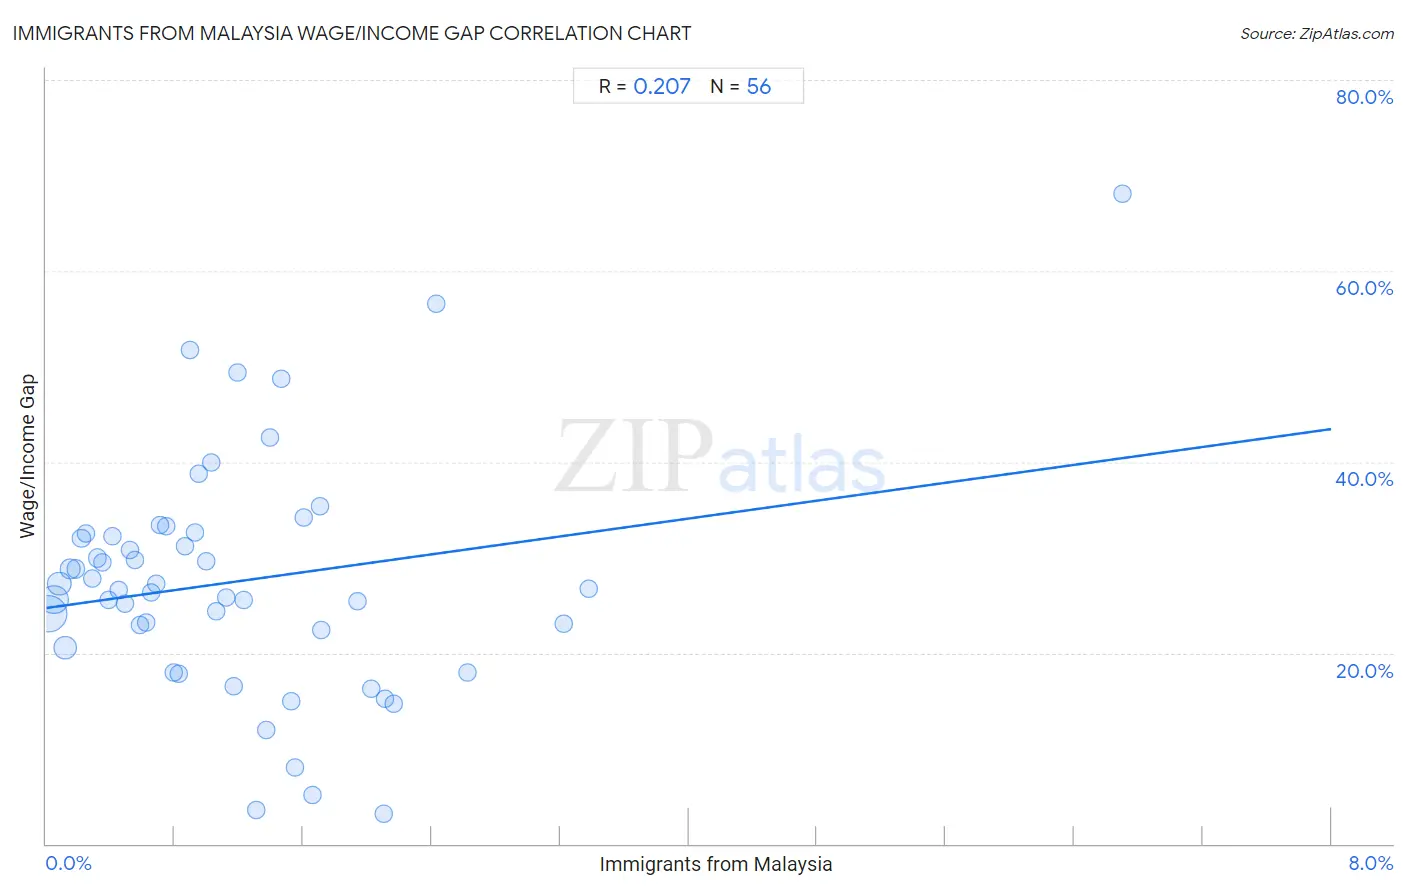
Immigrants from Malaysia Wage/Income Gap Correlation Chart
The statistical analysis conducted on geographies consisting of 197,939,281 people shows a weak positive correlation between the proportion of Immigrants from Malaysia and wage/income gap percentage in the United States with a correlation coefficient (R) of 0.207 and weighted average of 26.3%. On average, for every 1% (one percent) increase in Immigrants from Malaysia within a typical geography, there is an increase of 2.3% in wage/income gap percentage.
It is essential to understand that the correlation between the percentage of Immigrants from Malaysia and wage/income gap percentage does not imply a direct cause-and-effect relationship. It remains uncertain whether the presence of Immigrants from Malaysia influences an upward or downward trend in the level of wage/income gap percentage within an area, or if Immigrants from Malaysia simply ended up residing in those areas with higher or lower levels of wage/income gap percentage due to other factors.
Demographics Similar to Immigrants from Malaysia by Wage/Income Gap
In terms of wage/income gap, the demographic groups most similar to Immigrants from Malaysia are Chilean (26.3%, a difference of 0.010%), Immigrants from Jordan (26.3%, a difference of 0.020%), Immigrants from Bulgaria (26.3%, a difference of 0.030%), Immigrants from Western Asia (26.3%, a difference of 0.050%), and Zimbabwean (26.3%, a difference of 0.060%).
| Demographics | Rating | Rank | Wage/Income Gap |
| Immigrants from Egypt | 29.9 /100 | #188 | Fair 26.1% |
| Immigrants from Moldova | 26.6 /100 | #189 | Fair 26.2% |
| Immigrants from Croatia | 24.8 /100 | #190 | Fair 26.2% |
| Immigrants from Venezuela | 24.7 /100 | #191 | Fair 26.2% |
| Immigrants from Bulgaria | 22.5 /100 | #192 | Fair 26.3% |
| Immigrants from Jordan | 22.4 /100 | #193 | Fair 26.3% |
| Chileans | 22.3 /100 | #194 | Fair 26.3% |
| Immigrants from Malaysia | 22.2 /100 | #195 | Fair 26.3% |
| Immigrants from Western Asia | 21.7 /100 | #196 | Fair 26.3% |
| Zimbabweans | 21.6 /100 | #197 | Fair 26.3% |
| Venezuelans | 21.5 /100 | #198 | Fair 26.3% |
| Dutch West Indians | 21.0 /100 | #199 | Fair 26.3% |
| Delaware | 20.9 /100 | #200 | Fair 26.3% |
| Immigrants from Syria | 19.3 /100 | #201 | Poor 26.4% |
| Laotians | 19.2 /100 | #202 | Poor 26.4% |
Immigrants from Malaysia Wage/Income Gap Correlation Summary
| Measurement | Immigrants from Malaysia Data | Wage/Income Gap Data |
| Minimum | 0.018% | 3.1% |
| Maximum | 6.7% | 68.0% |
| Range | 6.7% | 64.9% |
| Mean | 1.2% | 27.5% |
| Median | 0.94% | 26.6% |
| Interquartile 25% (IQ1) | 0.47% | 21.5% |
| Interquartile 75% (IQ3) | 1.6% | 32.4% |
| Interquartile Range (IQR) | 1.1% | 10.9% |
| Standard Deviation (Sample) | 1.1% | 12.3% |
| Standard Deviation (Population) | 1.1% | 12.2% |
Correlation Details
| Immigrants from Malaysia Percentile | Sample Size | Wage/Income Gap |
[ 0.0% - 0.5% ] 0.018% | 81,194,885 | 24.1% |
[ 0.0% - 0.5% ] 0.047% | 46,616,431 | 25.6% |
[ 0.0% - 0.5% ] 0.081% | 22,243,381 | 27.2% |
[ 0.0% - 0.5% ] 0.12% | 20,003,998 | 20.6% |
[ 0.0% - 0.5% ] 0.15% | 9,241,551 | 28.8% |
[ 0.0% - 0.5% ] 0.18% | 3,796,781 | 28.8% |
[ 0.0% - 0.5% ] 0.22% | 3,907,318 | 32.0% |
[ 0.0% - 0.5% ] 0.25% | 2,293,884 | 32.5% |
[ 0.0% - 0.5% ] 0.28% | 1,756,916 | 27.7% |
[ 0.0% - 0.5% ] 0.32% | 1,033,831 | 29.9% |
[ 0.0% - 0.5% ] 0.35% | 974,555 | 29.5% |
[ 0.0% - 0.5% ] 0.39% | 907,034 | 25.6% |
[ 0.0% - 0.5% ] 0.42% | 479,033 | 32.2% |
[ 0.0% - 0.5% ] 0.45% | 466,556 | 26.5% |
[ 0.0% - 0.5% ] 0.49% | 292,697 | 25.1% |
[ 0.5% - 1.0% ] 0.52% | 262,376 | 30.7% |
[ 0.5% - 1.0% ] 0.55% | 298,715 | 29.7% |
[ 0.5% - 1.0% ] 0.58% | 232,451 | 22.9% |
[ 0.5% - 1.0% ] 0.62% | 169,630 | 23.2% |
[ 0.5% - 1.0% ] 0.65% | 264,999 | 26.4% |
[ 0.5% - 1.0% ] 0.69% | 252,820 | 27.3% |
[ 0.5% - 1.0% ] 0.71% | 149,441 | 33.4% |
[ 0.5% - 1.0% ] 0.75% | 167,532 | 33.3% |
[ 0.5% - 1.0% ] 0.80% | 141,983 | 17.9% |
[ 0.5% - 1.0% ] 0.82% | 45,317 | 17.8% |
[ 0.5% - 1.0% ] 0.86% | 146,073 | 31.1% |
[ 0.5% - 1.0% ] 0.89% | 38,535 | 51.7% |
[ 0.5% - 1.0% ] 0.93% | 82,653 | 32.5% |
[ 0.5% - 1.0% ] 0.95% | 27,709 | 38.7% |
[ 0.5% - 1.0% ] 0.99% | 26,054 | 29.6% |
[ 1.0% - 1.5% ] 1.03% | 35,266 | 40.0% |
[ 1.0% - 1.5% ] 1.06% | 7,011 | 24.4% |
[ 1.0% - 1.5% ] 1.12% | 27,843 | 25.8% |
[ 1.0% - 1.5% ] 1.17% | 21,887 | 16.5% |
[ 1.0% - 1.5% ] 1.19% | 2,022 | 49.4% |
[ 1.0% - 1.5% ] 1.23% | 105,456 | 25.5% |
[ 1.0% - 1.5% ] 1.31% | 44,196 | 3.5% |
[ 1.0% - 1.5% ] 1.37% | 9,512 | 11.9% |
[ 1.0% - 1.5% ] 1.39% | 6,400 | 42.5% |
[ 1.0% - 1.5% ] 1.46% | 3,827 | 48.7% |
[ 1.5% - 2.0% ] 1.52% | 9,841 | 15.0% |
[ 1.5% - 2.0% ] 1.55% | 12,223 | 7.9% |
[ 1.5% - 2.0% ] 1.61% | 8,843 | 34.2% |
[ 1.5% - 2.0% ] 1.66% | 11,805 | 5.1% |
[ 1.5% - 2.0% ] 1.70% | 5,928 | 35.4% |
[ 1.5% - 2.0% ] 1.71% | 27,010 | 22.4% |
[ 1.5% - 2.0% ] 1.94% | 5,569 | 25.3% |
[ 2.0% - 2.5% ] 2.02% | 6,916 | 16.3% |
[ 2.0% - 2.5% ] 2.10% | 42,621 | 3.1% |
[ 2.0% - 2.5% ] 2.11% | 9,282 | 15.1% |
[ 2.0% - 2.5% ] 2.16% | 15,667 | 14.6% |
[ 2.0% - 2.5% ] 2.42% | 1,031 | 56.6% |
[ 2.5% - 3.0% ] 2.62% | 1,562 | 18.0% |
[ 3.0% - 3.5% ] 3.22% | 621 | 23.1% |
[ 3.0% - 3.5% ] 3.38% | 296 | 26.7% |
[ 6.5% - 7.0% ] 6.70% | 1,507 | 68.0% |