Immigrants from Malaysia 4 or more Vehicles in Household
COMPARE
Immigrants from Malaysia
Select to Compare
4 or more Vehicles in Household
Immigrants from Malaysia 4 or more Vehicles in Household
5.9%
4+ VEHICLES AVAILABLE
6.7/ 100
METRIC RATING
230th/ 347
METRIC RANK
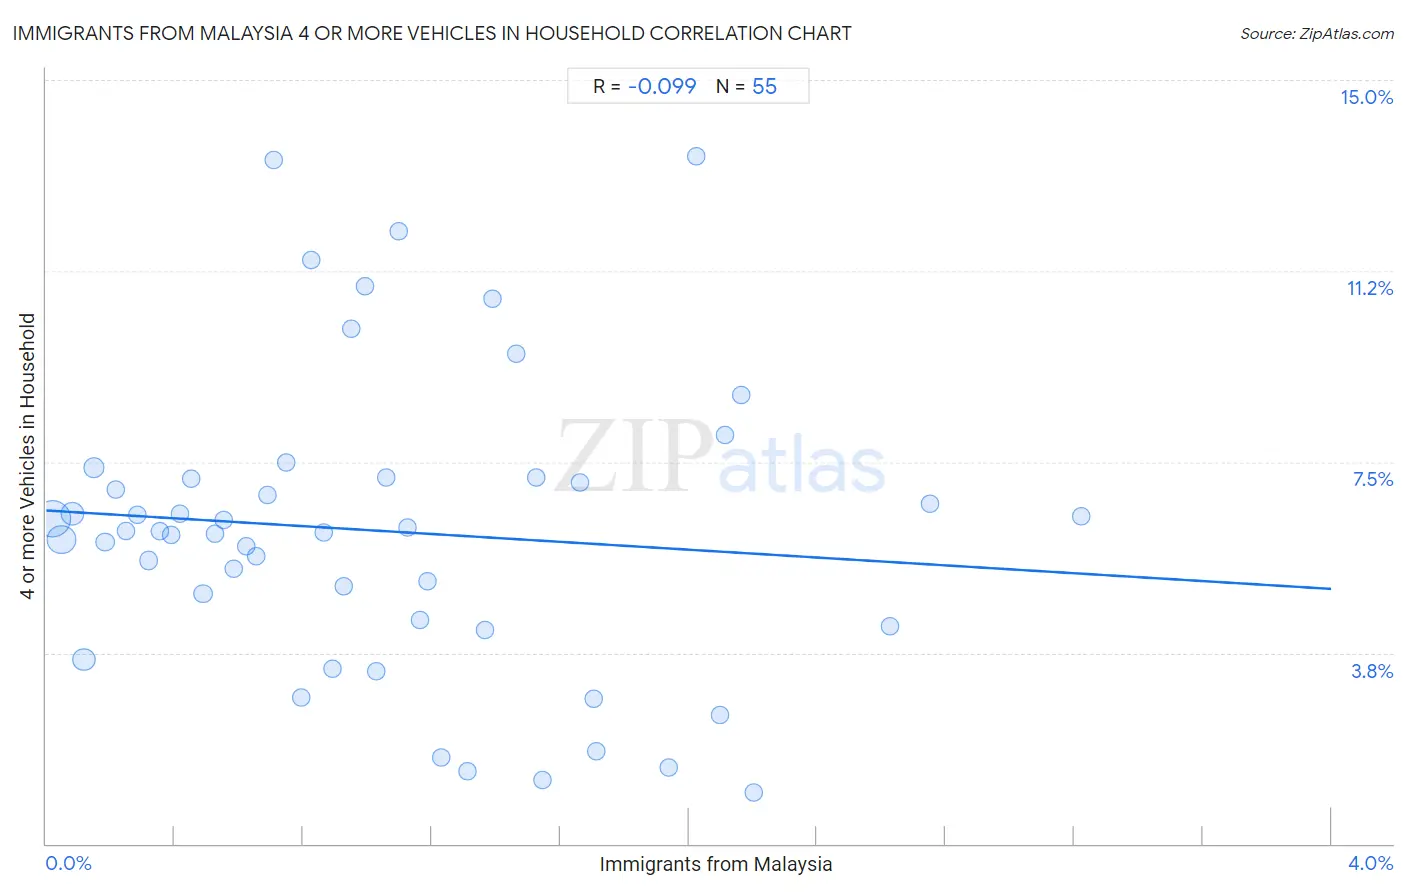
Immigrants from Malaysia 4 or more Vehicles in Household Correlation Chart
The statistical analysis conducted on geographies consisting of 197,160,103 people shows a slight negative correlation between the proportion of Immigrants from Malaysia and percentage of households with 4 or more vehicles available in the United States with a correlation coefficient (R) of -0.099 and weighted average of 5.9%. On average, for every 1% (one percent) increase in Immigrants from Malaysia within a typical geography, there is a decrease of 0.39% in percentage of households with 4 or more vehicles available.
It is essential to understand that the correlation between the percentage of Immigrants from Malaysia and percentage of households with 4 or more vehicles available does not imply a direct cause-and-effect relationship. It remains uncertain whether the presence of Immigrants from Malaysia influences an upward or downward trend in the level of percentage of households with 4 or more vehicles available within an area, or if Immigrants from Malaysia simply ended up residing in those areas with higher or lower levels of percentage of households with 4 or more vehicles available due to other factors.
Demographics Similar to Immigrants from Malaysia by 4 or more Vehicles in Household
In terms of 4 or more vehicles in household, the demographic groups most similar to Immigrants from Malaysia are Eastern European (5.9%, a difference of 0.070%), Immigrants from Switzerland (5.9%, a difference of 0.12%), Immigrants from Argentina (5.9%, a difference of 0.30%), Sierra Leonean (5.9%, a difference of 0.31%), and Immigrants from Uganda (5.9%, a difference of 0.35%).
| Demographics | Rating | Rank | 4 or more Vehicles in Household |
| Immigrants from Kenya | 9.2 /100 | #223 | Tragic 6.0% |
| Cubans | 9.2 /100 | #224 | Tragic 6.0% |
| Indonesians | 8.9 /100 | #225 | Tragic 6.0% |
| Immigrants from Singapore | 7.9 /100 | #226 | Tragic 5.9% |
| Immigrants from Western Asia | 7.8 /100 | #227 | Tragic 5.9% |
| Immigrants from Uganda | 7.5 /100 | #228 | Tragic 5.9% |
| Eastern Europeans | 6.8 /100 | #229 | Tragic 5.9% |
| Immigrants from Malaysia | 6.7 /100 | #230 | Tragic 5.9% |
| Immigrants from Switzerland | 6.4 /100 | #231 | Tragic 5.9% |
| Immigrants from Argentina | 6.0 /100 | #232 | Tragic 5.9% |
| Sierra Leoneans | 6.0 /100 | #233 | Tragic 5.9% |
| Africans | 4.6 /100 | #234 | Tragic 5.8% |
| Immigrants from Hungary | 4.6 /100 | #235 | Tragic 5.8% |
| Immigrants from Eritrea | 4.5 /100 | #236 | Tragic 5.8% |
| Turks | 4.1 /100 | #237 | Tragic 5.8% |
Immigrants from Malaysia 4 or more Vehicles in Household Correlation Summary
| Measurement | Immigrants from Malaysia Data | 4 or more Vehicles in Household Data |
| Minimum | 0.018% | 1.0% |
| Maximum | 3.2% | 13.5% |
| Range | 3.2% | 12.5% |
| Mean | 1.1% | 6.1% |
| Median | 0.93% | 6.1% |
| Interquartile 25% (IQ1) | 0.45% | 4.3% |
| Interquartile 75% (IQ3) | 1.5% | 7.2% |
| Interquartile Range (IQR) | 1.1% | 2.9% |
| Standard Deviation (Sample) | 0.75% | 2.9% |
| Standard Deviation (Population) | 0.74% | 2.9% |
Correlation Details
| Immigrants from Malaysia Percentile | Sample Size | 4 or more Vehicles in Household |
[ 0.0% - 0.5% ] 0.018% | 81,013,725 | 6.4% |
[ 0.0% - 0.5% ] 0.047% | 46,493,855 | 6.0% |
[ 0.0% - 0.5% ] 0.081% | 22,103,426 | 6.5% |
[ 0.0% - 0.5% ] 0.12% | 19,958,168 | 3.6% |
[ 0.0% - 0.5% ] 0.15% | 9,228,047 | 7.4% |
[ 0.0% - 0.5% ] 0.18% | 3,787,981 | 5.9% |
[ 0.0% - 0.5% ] 0.22% | 3,847,642 | 7.0% |
[ 0.0% - 0.5% ] 0.25% | 2,282,016 | 6.1% |
[ 0.0% - 0.5% ] 0.28% | 1,747,185 | 6.5% |
[ 0.0% - 0.5% ] 0.32% | 1,024,307 | 5.6% |
[ 0.0% - 0.5% ] 0.35% | 945,889 | 6.1% |
[ 0.0% - 0.5% ] 0.39% | 902,530 | 6.1% |
[ 0.0% - 0.5% ] 0.42% | 476,936 | 6.5% |
[ 0.0% - 0.5% ] 0.45% | 464,569 | 7.2% |
[ 0.0% - 0.5% ] 0.49% | 283,098 | 4.9% |
[ 0.5% - 1.0% ] 0.52% | 260,130 | 6.1% |
[ 0.5% - 1.0% ] 0.55% | 298,715 | 6.4% |
[ 0.5% - 1.0% ] 0.58% | 220,605 | 5.4% |
[ 0.5% - 1.0% ] 0.62% | 170,599 | 5.8% |
[ 0.5% - 1.0% ] 0.65% | 262,667 | 5.6% |
[ 0.5% - 1.0% ] 0.69% | 192,340 | 6.9% |
[ 0.5% - 1.0% ] 0.71% | 147,228 | 13.4% |
[ 0.5% - 1.0% ] 0.75% | 136,602 | 7.5% |
[ 0.5% - 1.0% ] 0.80% | 135,644 | 2.9% |
[ 0.5% - 1.0% ] 0.82% | 45,317 | 11.5% |
[ 0.5% - 1.0% ] 0.86% | 146,073 | 6.1% |
[ 0.5% - 1.0% ] 0.89% | 35,836 | 3.4% |
[ 0.5% - 1.0% ] 0.93% | 82,653 | 5.1% |
[ 0.5% - 1.0% ] 0.95% | 27,709 | 10.1% |
[ 0.5% - 1.0% ] 0.99% | 26,662 | 11.0% |
[ 1.0% - 1.5% ] 1.03% | 35,266 | 3.4% |
[ 1.0% - 1.5% ] 1.06% | 3,498 | 7.2% |
[ 1.0% - 1.5% ] 1.10% | 638 | 12.0% |
[ 1.0% - 1.5% ] 1.12% | 27,843 | 6.2% |
[ 1.0% - 1.5% ] 1.17% | 21,887 | 4.4% |
[ 1.0% - 1.5% ] 1.19% | 2,696 | 5.2% |
[ 1.0% - 1.5% ] 1.23% | 105,456 | 1.7% |
[ 1.0% - 1.5% ] 1.31% | 44,655 | 1.4% |
[ 1.0% - 1.5% ] 1.37% | 9,512 | 4.2% |
[ 1.0% - 1.5% ] 1.39% | 6,400 | 10.7% |
[ 1.0% - 1.5% ] 1.46% | 3,827 | 9.6% |
[ 1.5% - 2.0% ] 1.52% | 9,841 | 7.2% |
[ 1.5% - 2.0% ] 1.55% | 12,223 | 1.2% |
[ 1.5% - 2.0% ] 1.66% | 11,805 | 7.1% |
[ 1.5% - 2.0% ] 1.70% | 5,928 | 2.8% |
[ 1.5% - 2.0% ] 1.71% | 27,010 | 1.8% |
[ 1.5% - 2.0% ] 1.94% | 5,569 | 1.5% |
[ 2.0% - 2.5% ] 2.02% | 6,916 | 13.5% |
[ 2.0% - 2.5% ] 2.10% | 42,621 | 2.5% |
[ 2.0% - 2.5% ] 2.11% | 9,282 | 8.0% |
[ 2.0% - 2.5% ] 2.16% | 15,667 | 8.8% |
[ 2.0% - 2.5% ] 2.20% | 681 | 1.0% |
[ 2.5% - 3.0% ] 2.62% | 1,562 | 4.3% |
[ 2.5% - 3.0% ] 2.75% | 545 | 6.7% |
[ 3.0% - 3.5% ] 3.22% | 621 | 6.4% |