Immigrants from Malaysia Self-Care Disability
COMPARE
Immigrants from Malaysia
Select to Compare
Self-Care Disability
Immigrants from Malaysia Self-Care Disability
2.3%
SELF-CARE DISABILITY
99.7/ 100
METRIC RATING
48th/ 347
METRIC RANK
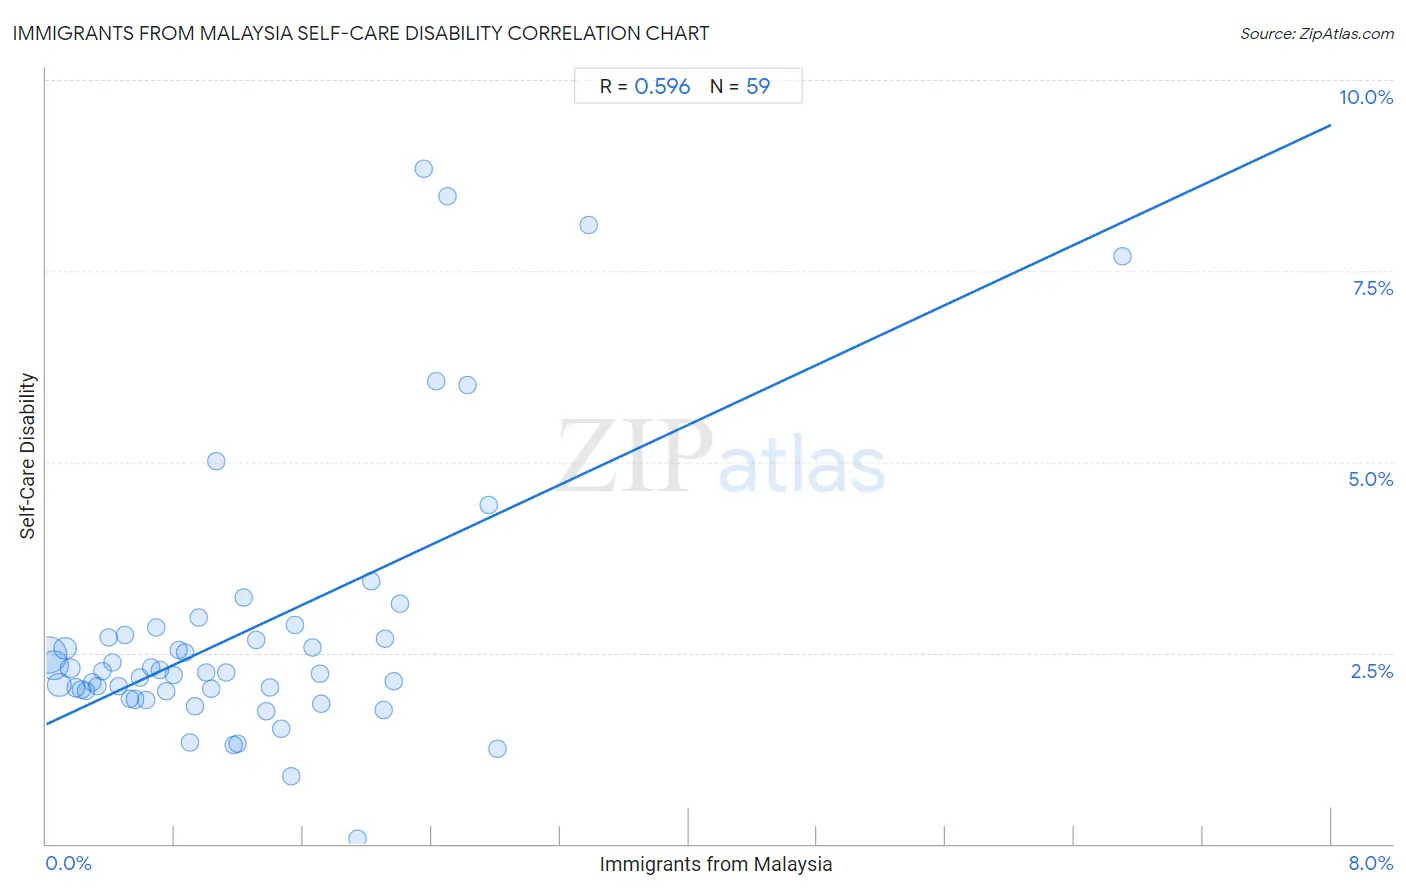
Immigrants from Malaysia Self-Care Disability Correlation Chart
The statistical analysis conducted on geographies consisting of 197,867,132 people shows a substantial positive correlation between the proportion of Immigrants from Malaysia and percentage of population with self-care disability in the United States with a correlation coefficient (R) of 0.596 and weighted average of 2.3%. On average, for every 1% (one percent) increase in Immigrants from Malaysia within a typical geography, there is an increase of 0.98% in percentage of population with self-care disability.
It is essential to understand that the correlation between the percentage of Immigrants from Malaysia and percentage of population with self-care disability does not imply a direct cause-and-effect relationship. It remains uncertain whether the presence of Immigrants from Malaysia influences an upward or downward trend in the level of percentage of population with self-care disability within an area, or if Immigrants from Malaysia simply ended up residing in those areas with higher or lower levels of percentage of population with self-care disability due to other factors.
Demographics Similar to Immigrants from Malaysia by Self-Care Disability
In terms of self-care disability, the demographic groups most similar to Immigrants from Malaysia are Jordanian (2.3%, a difference of 0.040%), Latvian (2.3%, a difference of 0.17%), Immigrants from Brazil (2.3%, a difference of 0.20%), Czech (2.3%, a difference of 0.27%), and Kenyan (2.3%, a difference of 0.34%).
| Demographics | Rating | Rank | Self-Care Disability |
| Immigrants from Sudan | 99.8 /100 | #41 | Exceptional 2.3% |
| Immigrants from Uganda | 99.8 /100 | #42 | Exceptional 2.3% |
| Immigrants from Pakistan | 99.8 /100 | #43 | Exceptional 2.3% |
| Immigrants from South Africa | 99.8 /100 | #44 | Exceptional 2.3% |
| Norwegians | 99.8 /100 | #45 | Exceptional 2.3% |
| Czechs | 99.8 /100 | #46 | Exceptional 2.3% |
| Jordanians | 99.7 /100 | #47 | Exceptional 2.3% |
| Immigrants from Malaysia | 99.7 /100 | #48 | Exceptional 2.3% |
| Latvians | 99.7 /100 | #49 | Exceptional 2.3% |
| Immigrants from Brazil | 99.7 /100 | #50 | Exceptional 2.3% |
| Kenyans | 99.7 /100 | #51 | Exceptional 2.3% |
| Immigrants from Serbia | 99.6 /100 | #52 | Exceptional 2.3% |
| Australians | 99.6 /100 | #53 | Exceptional 2.3% |
| Argentineans | 99.6 /100 | #54 | Exceptional 2.3% |
| Immigrants from France | 99.6 /100 | #55 | Exceptional 2.3% |
Immigrants from Malaysia Self-Care Disability Correlation Summary
| Measurement | Immigrants from Malaysia Data | Self-Care Disability Data |
| Minimum | 0.018% | 0.060% |
| Maximum | 6.7% | 8.8% |
| Range | 6.7% | 8.8% |
| Mean | 1.2% | 2.8% |
| Median | 0.99% | 2.2% |
| Interquartile 25% (IQ1) | 0.49% | 2.0% |
| Interquartile 75% (IQ3) | 1.7% | 2.7% |
| Interquartile Range (IQR) | 1.2% | 0.74% |
| Standard Deviation (Sample) | 1.1% | 1.8% |
| Standard Deviation (Population) | 1.1% | 1.8% |
Correlation Details
| Immigrants from Malaysia Percentile | Sample Size | Self-Care Disability |
[ 0.0% - 0.5% ] 0.018% | 81,194,885 | 2.5% |
[ 0.0% - 0.5% ] 0.047% | 46,621,717 | 2.3% |
[ 0.0% - 0.5% ] 0.081% | 22,243,381 | 2.1% |
[ 0.0% - 0.5% ] 0.12% | 19,989,265 | 2.6% |
[ 0.0% - 0.5% ] 0.15% | 9,239,557 | 2.3% |
[ 0.0% - 0.5% ] 0.18% | 3,793,623 | 2.0% |
[ 0.0% - 0.5% ] 0.22% | 3,907,646 | 2.0% |
[ 0.0% - 0.5% ] 0.25% | 2,284,115 | 2.0% |
[ 0.0% - 0.5% ] 0.28% | 1,747,185 | 2.1% |
[ 0.0% - 0.5% ] 0.32% | 1,035,402 | 2.1% |
[ 0.0% - 0.5% ] 0.35% | 961,417 | 2.3% |
[ 0.0% - 0.5% ] 0.39% | 902,530 | 2.7% |
[ 0.0% - 0.5% ] 0.42% | 476,748 | 2.4% |
[ 0.0% - 0.5% ] 0.45% | 467,218 | 2.1% |
[ 0.0% - 0.5% ] 0.49% | 287,142 | 2.7% |
[ 0.5% - 1.0% ] 0.52% | 260,130 | 1.9% |
[ 0.5% - 1.0% ] 0.55% | 298,715 | 1.9% |
[ 0.5% - 1.0% ] 0.58% | 232,451 | 2.2% |
[ 0.5% - 1.0% ] 0.62% | 167,068 | 1.9% |
[ 0.5% - 1.0% ] 0.65% | 262,667 | 2.3% |
[ 0.5% - 1.0% ] 0.69% | 252,820 | 2.8% |
[ 0.5% - 1.0% ] 0.71% | 149,441 | 2.3% |
[ 0.5% - 1.0% ] 0.75% | 164,087 | 2.0% |
[ 0.5% - 1.0% ] 0.80% | 144,038 | 2.2% |
[ 0.5% - 1.0% ] 0.82% | 45,317 | 2.5% |
[ 0.5% - 1.0% ] 0.86% | 146,073 | 2.5% |
[ 0.5% - 1.0% ] 0.89% | 38,535 | 1.3% |
[ 0.5% - 1.0% ] 0.93% | 82,653 | 1.8% |
[ 0.5% - 1.0% ] 0.95% | 28,641 | 3.0% |
[ 0.5% - 1.0% ] 0.99% | 26,662 | 2.2% |
[ 1.0% - 1.5% ] 1.03% | 35,266 | 2.0% |
[ 1.0% - 1.5% ] 1.06% | 3,498 | 5.0% |
[ 1.0% - 1.5% ] 1.12% | 27,843 | 2.2% |
[ 1.0% - 1.5% ] 1.17% | 21,887 | 1.3% |
[ 1.0% - 1.5% ] 1.19% | 2,696 | 1.3% |
[ 1.0% - 1.5% ] 1.23% | 106,526 | 3.2% |
[ 1.0% - 1.5% ] 1.31% | 44,196 | 2.7% |
[ 1.0% - 1.5% ] 1.37% | 9,512 | 1.7% |
[ 1.0% - 1.5% ] 1.39% | 6,400 | 2.0% |
[ 1.0% - 1.5% ] 1.46% | 3,827 | 1.5% |
[ 1.5% - 2.0% ] 1.52% | 9,841 | 0.89% |
[ 1.5% - 2.0% ] 1.55% | 12,223 | 2.9% |
[ 1.5% - 2.0% ] 1.66% | 11,805 | 2.6% |
[ 1.5% - 2.0% ] 1.70% | 5,928 | 2.2% |
[ 1.5% - 2.0% ] 1.71% | 27,010 | 1.8% |
[ 1.5% - 2.0% ] 1.94% | 5,569 | 0.060% |
[ 2.0% - 2.5% ] 2.02% | 6,916 | 3.4% |
[ 2.0% - 2.5% ] 2.10% | 42,621 | 1.7% |
[ 2.0% - 2.5% ] 2.11% | 9,282 | 2.7% |
[ 2.0% - 2.5% ] 2.16% | 15,667 | 2.1% |
[ 2.0% - 2.5% ] 2.20% | 681 | 3.1% |
[ 2.0% - 2.5% ] 2.35% | 170 | 8.8% |
[ 2.0% - 2.5% ] 2.42% | 1,031 | 6.1% |
[ 2.0% - 2.5% ] 2.50% | 1,200 | 8.5% |
[ 2.5% - 3.0% ] 2.62% | 1,562 | 6.0% |
[ 2.5% - 3.0% ] 2.75% | 545 | 4.4% |
[ 2.5% - 3.0% ] 2.81% | 498 | 1.2% |
[ 3.0% - 3.5% ] 3.38% | 296 | 8.1% |
[ 6.5% - 7.0% ] 6.70% | 1,507 | 7.7% |