Immigrants from Malaysia 3 or more Vehicles in Household
COMPARE
Immigrants from Malaysia
Select to Compare
3 or more Vehicles in Household
Immigrants from Malaysia 3 or more Vehicles in Household
18.3%
3+ VEHICLES AVAILABLE
3.6/ 100
METRIC RATING
236th/ 347
METRIC RANK
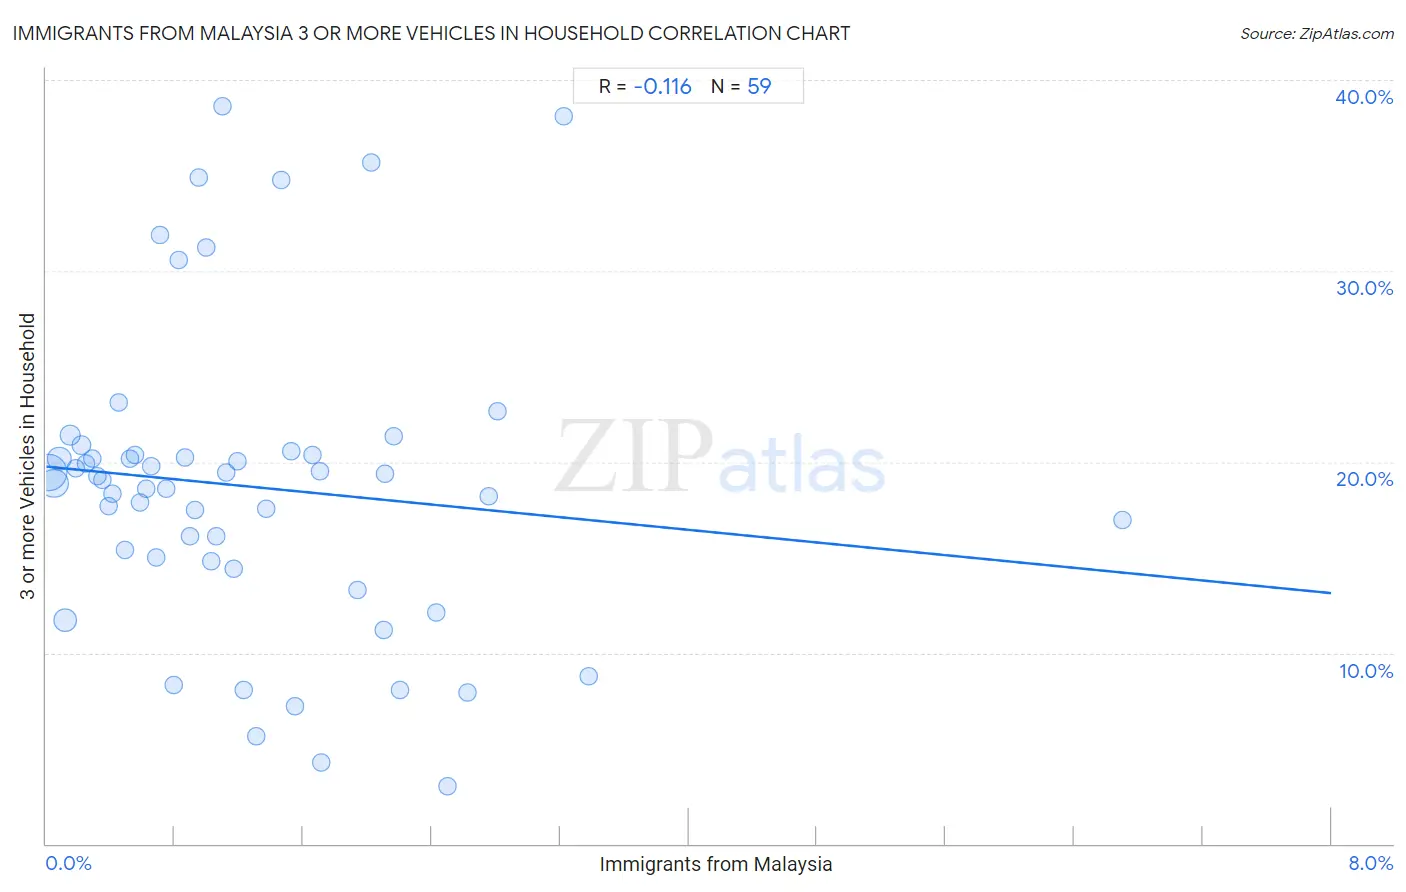
Immigrants from Malaysia 3 or more Vehicles in Household Correlation Chart
The statistical analysis conducted on geographies consisting of 197,846,297 people shows a poor negative correlation between the proportion of Immigrants from Malaysia and percentage of households with 3 or more vehicles available in the United States with a correlation coefficient (R) of -0.116 and weighted average of 18.3%. On average, for every 1% (one percent) increase in Immigrants from Malaysia within a typical geography, there is a decrease of 0.83% in percentage of households with 3 or more vehicles available.
It is essential to understand that the correlation between the percentage of Immigrants from Malaysia and percentage of households with 3 or more vehicles available does not imply a direct cause-and-effect relationship. It remains uncertain whether the presence of Immigrants from Malaysia influences an upward or downward trend in the level of percentage of households with 3 or more vehicles available within an area, or if Immigrants from Malaysia simply ended up residing in those areas with higher or lower levels of percentage of households with 3 or more vehicles available due to other factors.
Demographics Similar to Immigrants from Malaysia by 3 or more Vehicles in Household
In terms of 3 or more vehicles in household, the demographic groups most similar to Immigrants from Malaysia are Indonesian (18.3%, a difference of 0.040%), Sierra Leonean (18.3%, a difference of 0.18%), Immigrants from Honduras (18.2%, a difference of 0.28%), Immigrants from Middle Africa (18.2%, a difference of 0.28%), and Immigrants from China (18.2%, a difference of 0.41%).
| Demographics | Rating | Rank | 3 or more Vehicles in Household |
| Immigrants from Switzerland | 5.0 /100 | #229 | Tragic 18.4% |
| Immigrants from Western Asia | 4.8 /100 | #230 | Tragic 18.4% |
| Immigrants from Belgium | 4.8 /100 | #231 | Tragic 18.4% |
| Immigrants from Uganda | 4.6 /100 | #232 | Tragic 18.4% |
| Hondurans | 4.6 /100 | #233 | Tragic 18.4% |
| Immigrants from North Macedonia | 4.4 /100 | #234 | Tragic 18.4% |
| Sierra Leoneans | 3.9 /100 | #235 | Tragic 18.3% |
| Immigrants from Malaysia | 3.6 /100 | #236 | Tragic 18.3% |
| Indonesians | 3.5 /100 | #237 | Tragic 18.3% |
| Immigrants from Honduras | 3.1 /100 | #238 | Tragic 18.2% |
| Immigrants from Middle Africa | 3.1 /100 | #239 | Tragic 18.2% |
| Immigrants from China | 2.9 /100 | #240 | Tragic 18.2% |
| Africans | 2.7 /100 | #241 | Tragic 18.2% |
| Hopi | 2.5 /100 | #242 | Tragic 18.2% |
| Immigrants from Europe | 2.4 /100 | #243 | Tragic 18.1% |
Immigrants from Malaysia 3 or more Vehicles in Household Correlation Summary
| Measurement | Immigrants from Malaysia Data | 3 or more Vehicles in Household Data |
| Minimum | 0.018% | 3.0% |
| Maximum | 6.7% | 38.6% |
| Range | 6.7% | 35.6% |
| Mean | 1.3% | 18.7% |
| Median | 0.99% | 19.1% |
| Interquartile 25% (IQ1) | 0.49% | 14.8% |
| Interquartile 75% (IQ3) | 1.7% | 20.3% |
| Interquartile Range (IQR) | 1.2% | 5.5% |
| Standard Deviation (Sample) | 1.1% | 8.0% |
| Standard Deviation (Population) | 1.1% | 7.9% |
Correlation Details
| Immigrants from Malaysia Percentile | Sample Size | 3 or more Vehicles in Household |
[ 0.0% - 0.5% ] 0.018% | 81,178,487 | 19.5% |
[ 0.0% - 0.5% ] 0.047% | 46,605,365 | 18.9% |
[ 0.0% - 0.5% ] 0.081% | 22,243,381 | 20.2% |
[ 0.0% - 0.5% ] 0.12% | 19,989,049 | 11.7% |
[ 0.0% - 0.5% ] 0.15% | 9,239,557 | 21.4% |
[ 0.0% - 0.5% ] 0.18% | 3,796,210 | 19.7% |
[ 0.0% - 0.5% ] 0.22% | 3,903,935 | 20.9% |
[ 0.0% - 0.5% ] 0.25% | 2,282,016 | 19.9% |
[ 0.0% - 0.5% ] 0.28% | 1,747,185 | 20.2% |
[ 0.0% - 0.5% ] 0.32% | 1,024,307 | 19.2% |
[ 0.0% - 0.5% ] 0.35% | 972,828 | 19.1% |
[ 0.0% - 0.5% ] 0.39% | 902,530 | 17.7% |
[ 0.0% - 0.5% ] 0.42% | 481,159 | 18.3% |
[ 0.0% - 0.5% ] 0.45% | 467,218 | 23.1% |
[ 0.0% - 0.5% ] 0.49% | 296,741 | 15.4% |
[ 0.5% - 1.0% ] 0.52% | 260,130 | 20.2% |
[ 0.5% - 1.0% ] 0.55% | 298,715 | 20.3% |
[ 0.5% - 1.0% ] 0.58% | 232,451 | 17.8% |
[ 0.5% - 1.0% ] 0.62% | 170,599 | 18.6% |
[ 0.5% - 1.0% ] 0.65% | 264,999 | 19.8% |
[ 0.5% - 1.0% ] 0.69% | 252,820 | 15.0% |
[ 0.5% - 1.0% ] 0.71% | 149,441 | 31.9% |
[ 0.5% - 1.0% ] 0.75% | 167,532 | 18.6% |
[ 0.5% - 1.0% ] 0.80% | 144,038 | 8.3% |
[ 0.5% - 1.0% ] 0.82% | 45,317 | 30.6% |
[ 0.5% - 1.0% ] 0.86% | 146,073 | 20.2% |
[ 0.5% - 1.0% ] 0.89% | 35,836 | 16.1% |
[ 0.5% - 1.0% ] 0.93% | 82,653 | 17.5% |
[ 0.5% - 1.0% ] 0.95% | 28,641 | 34.9% |
[ 0.5% - 1.0% ] 0.99% | 26,662 | 31.2% |
[ 1.0% - 1.5% ] 1.03% | 35,266 | 14.8% |
[ 1.0% - 1.5% ] 1.06% | 3,498 | 16.1% |
[ 1.0% - 1.5% ] 1.10% | 638 | 38.6% |
[ 1.0% - 1.5% ] 1.12% | 27,843 | 19.4% |
[ 1.0% - 1.5% ] 1.17% | 21,887 | 14.4% |
[ 1.0% - 1.5% ] 1.19% | 2,696 | 20.0% |
[ 1.0% - 1.5% ] 1.23% | 105,456 | 8.1% |
[ 1.0% - 1.5% ] 1.31% | 44,655 | 5.6% |
[ 1.0% - 1.5% ] 1.37% | 9,512 | 17.6% |
[ 1.0% - 1.5% ] 1.46% | 4,168 | 34.8% |
[ 1.5% - 2.0% ] 1.52% | 9,841 | 20.6% |
[ 1.5% - 2.0% ] 1.55% | 12,223 | 7.2% |
[ 1.5% - 2.0% ] 1.66% | 11,805 | 20.3% |
[ 1.5% - 2.0% ] 1.70% | 5,928 | 19.5% |
[ 1.5% - 2.0% ] 1.71% | 27,010 | 4.3% |
[ 1.5% - 2.0% ] 1.94% | 5,569 | 13.3% |
[ 2.0% - 2.5% ] 2.02% | 6,916 | 35.7% |
[ 2.0% - 2.5% ] 2.10% | 42,621 | 11.2% |
[ 2.0% - 2.5% ] 2.11% | 9,282 | 19.3% |
[ 2.0% - 2.5% ] 2.16% | 15,667 | 21.3% |
[ 2.0% - 2.5% ] 2.20% | 681 | 8.1% |
[ 2.0% - 2.5% ] 2.42% | 1,031 | 12.1% |
[ 2.0% - 2.5% ] 2.50% | 1,200 | 3.0% |
[ 2.5% - 3.0% ] 2.62% | 1,562 | 7.9% |
[ 2.5% - 3.0% ] 2.75% | 545 | 18.2% |
[ 2.5% - 3.0% ] 2.81% | 498 | 22.7% |
[ 3.0% - 3.5% ] 3.22% | 621 | 38.1% |
[ 3.0% - 3.5% ] 3.38% | 296 | 8.7% |
[ 6.5% - 7.0% ] 6.70% | 1,507 | 17.0% |