Immigrants from Malaysia 2 or more Vehicles in Household
COMPARE
Immigrants from Malaysia
Select to Compare
2 or more Vehicles in Household
Immigrants from Malaysia 2 or more Vehicles in Household
52.7%
2+ VEHICLES AVAILABLE
0.8/ 100
METRIC RATING
254th/ 347
METRIC RANK
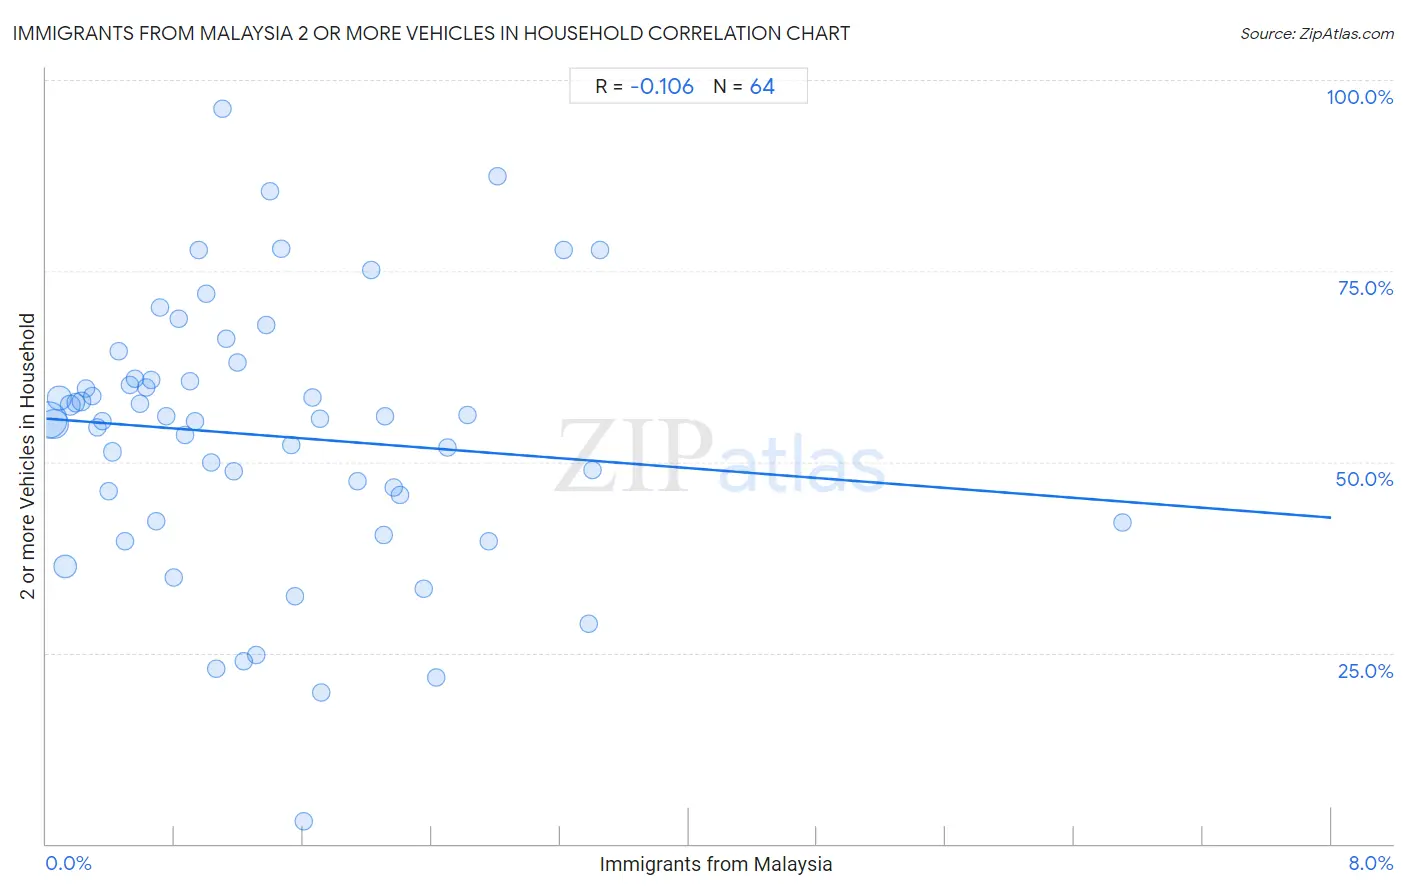
Immigrants from Malaysia 2 or more Vehicles in Household Correlation Chart
The statistical analysis conducted on geographies consisting of 197,930,354 people shows a poor negative correlation between the proportion of Immigrants from Malaysia and percentage of households with 2 or more vehicles available in the United States with a correlation coefficient (R) of -0.106 and weighted average of 52.7%. On average, for every 1% (one percent) increase in Immigrants from Malaysia within a typical geography, there is a decrease of 1.6% in percentage of households with 2 or more vehicles available.
It is essential to understand that the correlation between the percentage of Immigrants from Malaysia and percentage of households with 2 or more vehicles available does not imply a direct cause-and-effect relationship. It remains uncertain whether the presence of Immigrants from Malaysia influences an upward or downward trend in the level of percentage of households with 2 or more vehicles available within an area, or if Immigrants from Malaysia simply ended up residing in those areas with higher or lower levels of percentage of households with 2 or more vehicles available due to other factors.
Demographics Similar to Immigrants from Malaysia by 2 or more Vehicles in Household
In terms of 2 or more vehicles in household, the demographic groups most similar to Immigrants from Malaysia are Uruguayan (52.7%, a difference of 0.030%), Immigrants from Eritrea (52.6%, a difference of 0.070%), Nigerian (52.8%, a difference of 0.19%), Immigrants from Hong Kong (52.6%, a difference of 0.21%), and Immigrants from Portugal (52.8%, a difference of 0.24%).
| Demographics | Rating | Rank | 2 or more Vehicles in Household |
| Sierra Leoneans | 1.2 /100 | #247 | Tragic 52.9% |
| Colombians | 1.1 /100 | #248 | Tragic 52.9% |
| Immigrants from Brazil | 1.0 /100 | #249 | Tragic 52.8% |
| Mongolians | 1.0 /100 | #250 | Tragic 52.8% |
| Immigrants from Sudan | 1.0 /100 | #251 | Tragic 52.8% |
| Immigrants from Portugal | 1.0 /100 | #252 | Tragic 52.8% |
| Nigerians | 0.9 /100 | #253 | Tragic 52.8% |
| Immigrants from Malaysia | 0.8 /100 | #254 | Tragic 52.7% |
| Uruguayans | 0.7 /100 | #255 | Tragic 52.7% |
| Immigrants from Eritrea | 0.7 /100 | #256 | Tragic 52.6% |
| Immigrants from Hong Kong | 0.6 /100 | #257 | Tragic 52.6% |
| Central American Indians | 0.6 /100 | #258 | Tragic 52.5% |
| Alsatians | 0.6 /100 | #259 | Tragic 52.5% |
| Immigrants from Bahamas | 0.5 /100 | #260 | Tragic 52.5% |
| Immigrants from Australia | 0.5 /100 | #261 | Tragic 52.4% |
Immigrants from Malaysia 2 or more Vehicles in Household Correlation Summary
| Measurement | Immigrants from Malaysia Data | 2 or more Vehicles in Household Data |
| Minimum | 0.018% | 2.9% |
| Maximum | 6.7% | 96.2% |
| Range | 6.7% | 93.3% |
| Mean | 1.4% | 53.5% |
| Median | 1.1% | 55.5% |
| Interquartile 25% (IQ1) | 0.54% | 43.9% |
| Interquartile 75% (IQ3) | 2.0% | 60.8% |
| Interquartile Range (IQR) | 1.4% | 16.9% |
| Standard Deviation (Sample) | 1.1% | 17.5% |
| Standard Deviation (Population) | 1.1% | 17.3% |
Correlation Details
| Immigrants from Malaysia Percentile | Sample Size | 2 or more Vehicles in Household |
[ 0.0% - 0.5% ] 0.018% | 81,194,885 | 55.4% |
[ 0.0% - 0.5% ] 0.047% | 46,605,365 | 55.0% |
[ 0.0% - 0.5% ] 0.081% | 22,243,381 | 58.4% |
[ 0.0% - 0.5% ] 0.12% | 20,001,038 | 36.3% |
[ 0.0% - 0.5% ] 0.15% | 9,239,557 | 57.5% |
[ 0.0% - 0.5% ] 0.18% | 3,796,210 | 57.8% |
[ 0.0% - 0.5% ] 0.22% | 3,909,570 | 57.9% |
[ 0.0% - 0.5% ] 0.25% | 2,293,529 | 59.6% |
[ 0.0% - 0.5% ] 0.28% | 1,747,185 | 58.6% |
[ 0.0% - 0.5% ] 0.32% | 1,037,223 | 54.5% |
[ 0.0% - 0.5% ] 0.35% | 974,555 | 55.4% |
[ 0.0% - 0.5% ] 0.39% | 902,530 | 46.1% |
[ 0.0% - 0.5% ] 0.42% | 481,159 | 51.3% |
[ 0.0% - 0.5% ] 0.45% | 467,218 | 64.4% |
[ 0.0% - 0.5% ] 0.49% | 296,741 | 39.7% |
[ 0.5% - 1.0% ] 0.52% | 262,376 | 60.1% |
[ 0.5% - 1.0% ] 0.55% | 298,715 | 60.9% |
[ 0.5% - 1.0% ] 0.58% | 232,451 | 57.7% |
[ 0.5% - 1.0% ] 0.62% | 170,599 | 59.7% |
[ 0.5% - 1.0% ] 0.65% | 264,999 | 60.7% |
[ 0.5% - 1.0% ] 0.69% | 252,820 | 42.2% |
[ 0.5% - 1.0% ] 0.71% | 150,698 | 70.3% |
[ 0.5% - 1.0% ] 0.75% | 167,532 | 55.9% |
[ 0.5% - 1.0% ] 0.80% | 144,038 | 34.9% |
[ 0.5% - 1.0% ] 0.82% | 45,317 | 68.7% |
[ 0.5% - 1.0% ] 0.86% | 146,073 | 53.6% |
[ 0.5% - 1.0% ] 0.89% | 35,836 | 60.6% |
[ 0.5% - 1.0% ] 0.93% | 82,653 | 55.2% |
[ 0.5% - 1.0% ] 0.95% | 28,641 | 77.7% |
[ 0.5% - 1.0% ] 0.99% | 26,662 | 72.1% |
[ 1.0% - 1.5% ] 1.03% | 35,266 | 49.9% |
[ 1.0% - 1.5% ] 1.06% | 7,011 | 23.0% |
[ 1.0% - 1.5% ] 1.10% | 638 | 96.2% |
[ 1.0% - 1.5% ] 1.12% | 27,843 | 66.2% |
[ 1.0% - 1.5% ] 1.17% | 21,887 | 48.9% |
[ 1.0% - 1.5% ] 1.19% | 2,696 | 63.0% |
[ 1.0% - 1.5% ] 1.23% | 106,526 | 23.8% |
[ 1.0% - 1.5% ] 1.31% | 44,655 | 24.7% |
[ 1.0% - 1.5% ] 1.37% | 9,512 | 67.9% |
[ 1.0% - 1.5% ] 1.39% | 6,400 | 85.5% |
[ 1.0% - 1.5% ] 1.46% | 4,168 | 77.9% |
[ 1.5% - 2.0% ] 1.52% | 9,841 | 52.2% |
[ 1.5% - 2.0% ] 1.55% | 12,223 | 32.4% |
[ 1.5% - 2.0% ] 1.61% | 8,843 | 2.9% |
[ 1.5% - 2.0% ] 1.66% | 11,805 | 58.5% |
[ 1.5% - 2.0% ] 1.70% | 5,928 | 55.7% |
[ 1.5% - 2.0% ] 1.71% | 27,010 | 19.9% |
[ 1.5% - 2.0% ] 1.94% | 5,569 | 47.5% |
[ 2.0% - 2.5% ] 2.02% | 6,916 | 75.1% |
[ 2.0% - 2.5% ] 2.10% | 42,621 | 40.5% |
[ 2.0% - 2.5% ] 2.11% | 9,282 | 56.0% |
[ 2.0% - 2.5% ] 2.16% | 15,667 | 46.6% |
[ 2.0% - 2.5% ] 2.20% | 681 | 45.6% |
[ 2.0% - 2.5% ] 2.35% | 170 | 33.3% |
[ 2.0% - 2.5% ] 2.42% | 1,031 | 21.8% |
[ 2.0% - 2.5% ] 2.50% | 1,200 | 51.9% |
[ 2.5% - 3.0% ] 2.62% | 1,562 | 56.1% |
[ 2.5% - 3.0% ] 2.75% | 545 | 39.6% |
[ 2.5% - 3.0% ] 2.81% | 498 | 87.4% |
[ 3.0% - 3.5% ] 3.22% | 621 | 77.7% |
[ 3.0% - 3.5% ] 3.38% | 296 | 28.7% |
[ 3.0% - 3.5% ] 3.40% | 235 | 48.9% |
[ 3.0% - 3.5% ] 3.45% | 145 | 77.8% |
[ 6.5% - 7.0% ] 6.70% | 1,507 | 42.1% |