Immigrants from Malaysia Married-couple Households
COMPARE
Immigrants from Malaysia
Select to Compare
Married-couple Households
Immigrants from Malaysia Married-couple Households
47.2%
MARRIED-COUPLE HOUSEHOLDS
85.2/ 100
METRIC RATING
137th/ 347
METRIC RANK
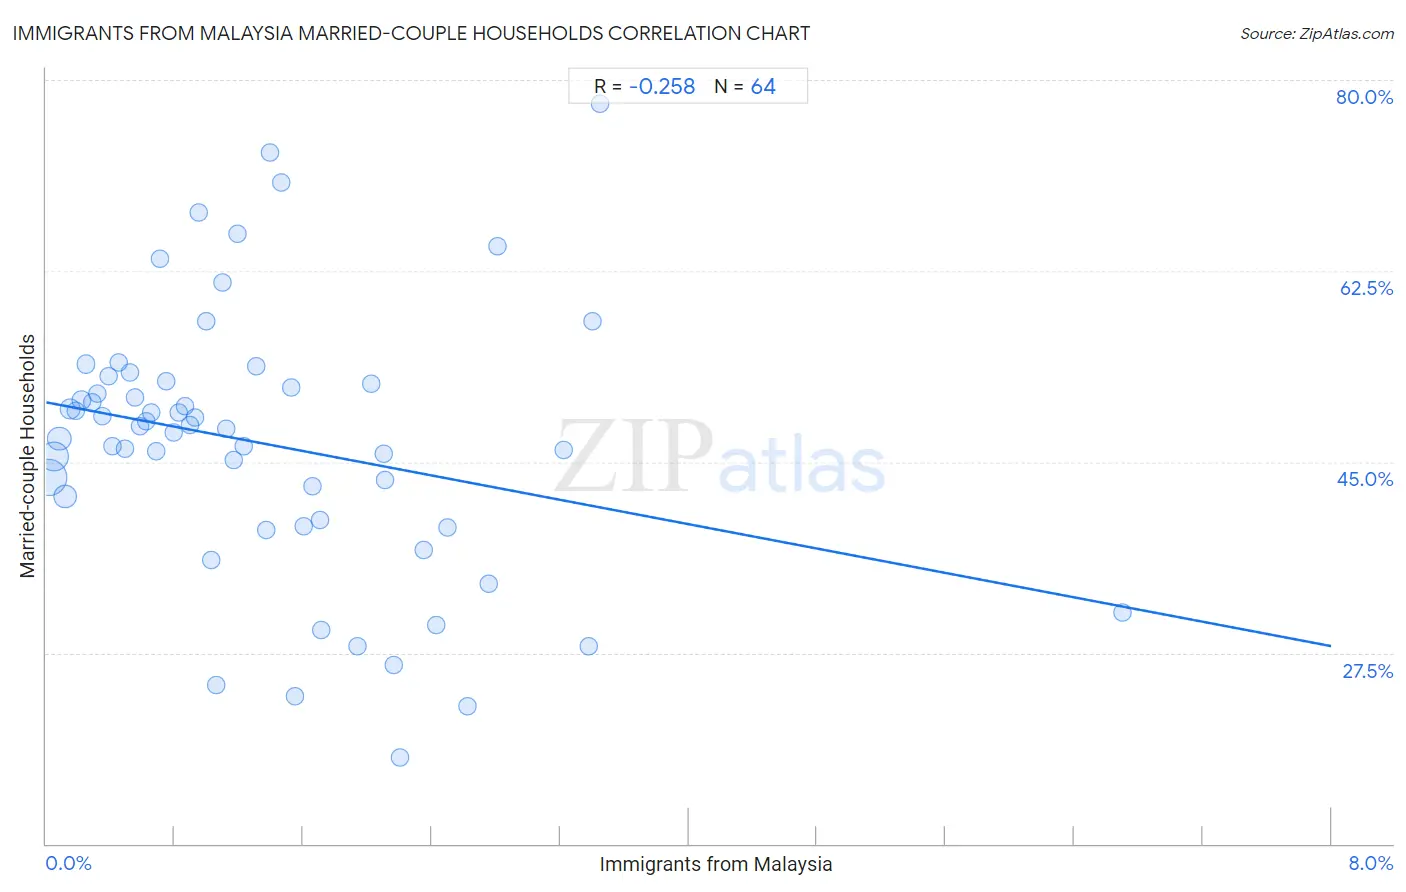
Immigrants from Malaysia Married-couple Households Correlation Chart
The statistical analysis conducted on geographies consisting of 197,920,674 people shows a weak negative correlation between the proportion of Immigrants from Malaysia and percentage of married-couple family households in the United States with a correlation coefficient (R) of -0.258 and weighted average of 47.2%. On average, for every 1% (one percent) increase in Immigrants from Malaysia within a typical geography, there is a decrease of 2.8% in percentage of married-couple family households.
It is essential to understand that the correlation between the percentage of Immigrants from Malaysia and percentage of married-couple family households does not imply a direct cause-and-effect relationship. It remains uncertain whether the presence of Immigrants from Malaysia influences an upward or downward trend in the level of percentage of married-couple family households within an area, or if Immigrants from Malaysia simply ended up residing in those areas with higher or lower levels of percentage of married-couple family households due to other factors.
Demographics Similar to Immigrants from Malaysia by Married-couple Households
In terms of married-couple households, the demographic groups most similar to Immigrants from Malaysia are New Zealander (47.2%, a difference of 0.0%), Immigrants from Afghanistan (47.2%, a difference of 0.010%), Immigrants from Sweden (47.2%, a difference of 0.040%), Immigrants from Greece (47.2%, a difference of 0.060%), and Immigrants from Argentina (47.2%, a difference of 0.060%).
| Demographics | Rating | Rank | Married-couple Households |
| Immigrants from Hungary | 87.8 /100 | #130 | Excellent 47.3% |
| Immigrants from Denmark | 87.5 /100 | #131 | Excellent 47.3% |
| Immigrants from Ukraine | 86.7 /100 | #132 | Excellent 47.3% |
| South Africans | 86.4 /100 | #133 | Excellent 47.3% |
| Immigrants from Greece | 86.0 /100 | #134 | Excellent 47.2% |
| Immigrants from Argentina | 86.0 /100 | #135 | Excellent 47.2% |
| New Zealanders | 85.3 /100 | #136 | Excellent 47.2% |
| Immigrants from Malaysia | 85.2 /100 | #137 | Excellent 47.2% |
| Immigrants from Afghanistan | 85.1 /100 | #138 | Excellent 47.2% |
| Immigrants from Sweden | 84.7 /100 | #139 | Excellent 47.2% |
| Spanish | 84.5 /100 | #140 | Excellent 47.2% |
| Costa Ricans | 84.4 /100 | #141 | Excellent 47.2% |
| Spaniards | 84.1 /100 | #142 | Excellent 47.2% |
| Immigrants from Belarus | 83.8 /100 | #143 | Excellent 47.2% |
| Mexicans | 83.4 /100 | #144 | Excellent 47.1% |
Immigrants from Malaysia Married-couple Households Correlation Summary
| Measurement | Immigrants from Malaysia Data | Married-couple Households Data |
| Minimum | 0.018% | 17.9% |
| Maximum | 6.7% | 77.8% |
| Range | 6.7% | 59.9% |
| Mean | 1.4% | 46.7% |
| Median | 1.1% | 48.2% |
| Interquartile 25% (IQ1) | 0.54% | 39.4% |
| Interquartile 75% (IQ3) | 2.0% | 52.3% |
| Interquartile Range (IQR) | 1.4% | 12.8% |
| Standard Deviation (Sample) | 1.1% | 12.4% |
| Standard Deviation (Population) | 1.1% | 12.3% |
Correlation Details
| Immigrants from Malaysia Percentile | Sample Size | Married-couple Households |
[ 0.0% - 0.5% ] 0.018% | 81,194,885 | 43.5% |
[ 0.0% - 0.5% ] 0.047% | 46,605,365 | 45.5% |
[ 0.0% - 0.5% ] 0.081% | 22,237,480 | 47.1% |
[ 0.0% - 0.5% ] 0.12% | 20,001,038 | 41.8% |
[ 0.0% - 0.5% ] 0.15% | 9,241,551 | 49.8% |
[ 0.0% - 0.5% ] 0.18% | 3,796,210 | 49.7% |
[ 0.0% - 0.5% ] 0.22% | 3,909,570 | 50.7% |
[ 0.0% - 0.5% ] 0.25% | 2,293,529 | 54.0% |
[ 0.0% - 0.5% ] 0.28% | 1,747,185 | 50.5% |
[ 0.0% - 0.5% ] 0.32% | 1,031,450 | 51.3% |
[ 0.0% - 0.5% ] 0.35% | 974,555 | 49.1% |
[ 0.0% - 0.5% ] 0.39% | 902,530 | 52.9% |
[ 0.0% - 0.5% ] 0.42% | 481,159 | 46.4% |
[ 0.0% - 0.5% ] 0.45% | 467,218 | 54.1% |
[ 0.0% - 0.5% ] 0.49% | 296,741 | 46.2% |
[ 0.5% - 1.0% ] 0.52% | 262,376 | 53.2% |
[ 0.5% - 1.0% ] 0.55% | 298,715 | 50.9% |
[ 0.5% - 1.0% ] 0.58% | 232,451 | 48.3% |
[ 0.5% - 1.0% ] 0.62% | 170,599 | 48.8% |
[ 0.5% - 1.0% ] 0.65% | 264,999 | 49.5% |
[ 0.5% - 1.0% ] 0.69% | 252,820 | 46.0% |
[ 0.5% - 1.0% ] 0.71% | 150,698 | 63.6% |
[ 0.5% - 1.0% ] 0.75% | 167,532 | 52.4% |
[ 0.5% - 1.0% ] 0.80% | 144,038 | 47.7% |
[ 0.5% - 1.0% ] 0.82% | 45,317 | 49.6% |
[ 0.5% - 1.0% ] 0.86% | 146,073 | 50.1% |
[ 0.5% - 1.0% ] 0.89% | 35,836 | 48.3% |
[ 0.5% - 1.0% ] 0.93% | 82,653 | 49.0% |
[ 0.5% - 1.0% ] 0.95% | 28,641 | 67.9% |
[ 0.5% - 1.0% ] 0.99% | 26,662 | 57.9% |
[ 1.0% - 1.5% ] 1.03% | 35,266 | 36.0% |
[ 1.0% - 1.5% ] 1.06% | 7,011 | 24.5% |
[ 1.0% - 1.5% ] 1.10% | 638 | 61.4% |
[ 1.0% - 1.5% ] 1.12% | 27,843 | 48.1% |
[ 1.0% - 1.5% ] 1.17% | 21,887 | 45.2% |
[ 1.0% - 1.5% ] 1.19% | 2,696 | 65.9% |
[ 1.0% - 1.5% ] 1.23% | 106,526 | 46.5% |
[ 1.0% - 1.5% ] 1.31% | 44,655 | 53.8% |
[ 1.0% - 1.5% ] 1.37% | 9,512 | 38.7% |
[ 1.0% - 1.5% ] 1.39% | 6,400 | 73.3% |
[ 1.0% - 1.5% ] 1.46% | 4,168 | 70.6% |
[ 1.5% - 2.0% ] 1.52% | 9,841 | 51.8% |
[ 1.5% - 2.0% ] 1.55% | 12,223 | 23.5% |
[ 1.5% - 2.0% ] 1.61% | 8,843 | 39.2% |
[ 1.5% - 2.0% ] 1.66% | 11,805 | 42.8% |
[ 1.5% - 2.0% ] 1.70% | 5,928 | 39.7% |
[ 1.5% - 2.0% ] 1.71% | 27,010 | 29.6% |
[ 1.5% - 2.0% ] 1.94% | 5,569 | 28.2% |
[ 2.0% - 2.5% ] 2.02% | 6,916 | 52.2% |
[ 2.0% - 2.5% ] 2.10% | 42,621 | 45.8% |
[ 2.0% - 2.5% ] 2.11% | 9,282 | 43.3% |
[ 2.0% - 2.5% ] 2.16% | 15,667 | 26.3% |
[ 2.0% - 2.5% ] 2.20% | 681 | 17.9% |
[ 2.0% - 2.5% ] 2.35% | 170 | 36.9% |
[ 2.0% - 2.5% ] 2.42% | 1,031 | 30.1% |
[ 2.0% - 2.5% ] 2.50% | 1,200 | 38.9% |
[ 2.5% - 3.0% ] 2.62% | 1,562 | 22.6% |
[ 2.5% - 3.0% ] 2.75% | 545 | 33.8% |
[ 2.5% - 3.0% ] 2.81% | 498 | 64.8% |
[ 3.0% - 3.5% ] 3.22% | 621 | 46.0% |
[ 3.0% - 3.5% ] 3.38% | 296 | 28.1% |
[ 3.0% - 3.5% ] 3.40% | 235 | 57.9% |
[ 3.0% - 3.5% ] 3.45% | 145 | 77.8% |
[ 6.5% - 7.0% ] 6.70% | 1,507 | 31.2% |