Immigrants from Laos Married-Couple Family Poverty
COMPARE
Immigrants from Laos
Select to Compare
Married-Couple Family Poverty
Immigrants from Laos Married-Couple Family Poverty
5.7%
POVERTY | MARRIED-COUPLE FAMILIES
4.4/ 100
METRIC RATING
232nd/ 347
METRIC RANK
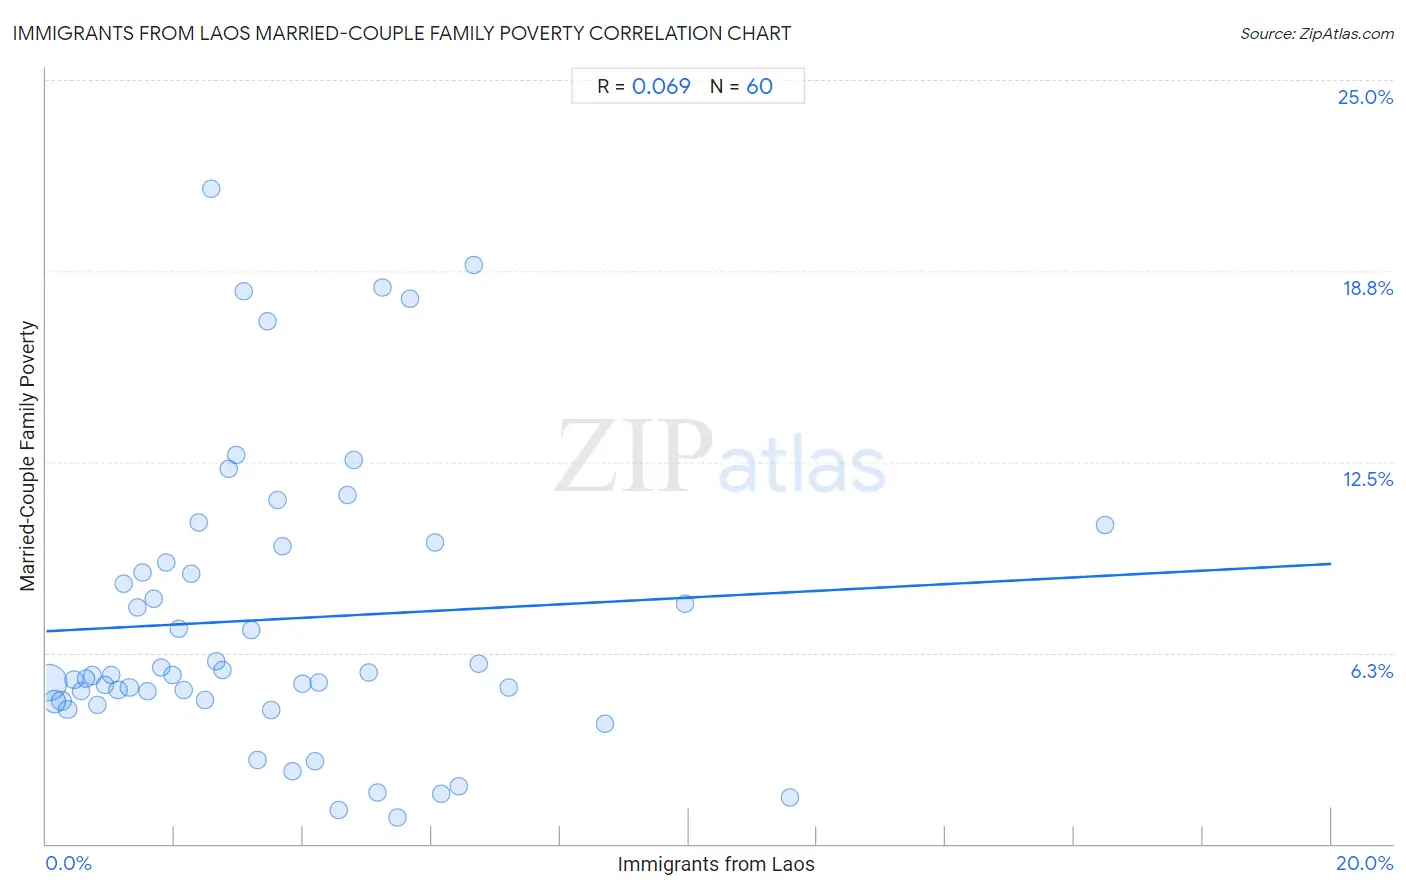
Immigrants from Laos Married-Couple Family Poverty Correlation Chart
The statistical analysis conducted on geographies consisting of 200,657,338 people shows a slight positive correlation between the proportion of Immigrants from Laos and poverty level among married-couple families in the United States with a correlation coefficient (R) of 0.069 and weighted average of 5.7%. On average, for every 1% (one percent) increase in Immigrants from Laos within a typical geography, there is an increase of 0.11% in poverty level among married-couple families.
It is essential to understand that the correlation between the percentage of Immigrants from Laos and poverty level among married-couple families does not imply a direct cause-and-effect relationship. It remains uncertain whether the presence of Immigrants from Laos influences an upward or downward trend in the level of poverty level among married-couple families within an area, or if Immigrants from Laos simply ended up residing in those areas with higher or lower levels of poverty level among married-couple families due to other factors.
Demographics Similar to Immigrants from Laos by Married-Couple Family Poverty
In terms of married-couple family poverty, the demographic groups most similar to Immigrants from Laos are Immigrants from Iraq (5.7%, a difference of 0.060%), Moroccan (5.7%, a difference of 0.32%), Subsaharan African (5.7%, a difference of 0.35%), Immigrants from Colombia (5.7%, a difference of 0.44%), and Immigrants from Uruguay (5.7%, a difference of 0.44%).
| Demographics | Rating | Rank | Married-Couple Family Poverty |
| Immigrants from Cambodia | 6.1 /100 | #225 | Tragic 5.6% |
| South Americans | 5.7 /100 | #226 | Tragic 5.6% |
| Immigrants from Zaire | 5.6 /100 | #227 | Tragic 5.6% |
| Arabs | 5.4 /100 | #228 | Tragic 5.7% |
| Sub-Saharan Africans | 4.9 /100 | #229 | Tragic 5.7% |
| Moroccans | 4.9 /100 | #230 | Tragic 5.7% |
| Immigrants from Iraq | 4.4 /100 | #231 | Tragic 5.7% |
| Immigrants from Laos | 4.4 /100 | #232 | Tragic 5.7% |
| Immigrants from Colombia | 3.7 /100 | #233 | Tragic 5.7% |
| Immigrants from Uruguay | 3.7 /100 | #234 | Tragic 5.7% |
| Immigrants from Sudan | 3.5 /100 | #235 | Tragic 5.7% |
| Ghanaians | 3.3 /100 | #236 | Tragic 5.7% |
| Immigrants from South America | 3.1 /100 | #237 | Tragic 5.7% |
| Cherokee | 2.7 /100 | #238 | Tragic 5.8% |
| Venezuelans | 2.7 /100 | #239 | Tragic 5.8% |
Immigrants from Laos Married-Couple Family Poverty Correlation Summary
| Measurement | Immigrants from Laos Data | Married-Couple Family Poverty Data |
| Minimum | 0.032% | 0.85% |
| Maximum | 16.5% | 21.4% |
| Range | 16.5% | 20.6% |
| Mean | 3.5% | 7.3% |
| Median | 2.9% | 5.5% |
| Interquartile 25% (IQ1) | 1.5% | 4.7% |
| Interquartile 75% (IQ3) | 4.9% | 9.5% |
| Interquartile Range (IQR) | 3.4% | 4.8% |
| Standard Deviation (Sample) | 3.0% | 4.8% |
| Standard Deviation (Population) | 3.0% | 4.7% |
Correlation Details
| Immigrants from Laos Percentile | Sample Size | Married-Couple Family Poverty |
[ 0.0% - 0.5% ] 0.032% | 129,972,037 | 5.3% |
[ 0.0% - 0.5% ] 0.13% | 30,012,745 | 4.7% |
[ 0.0% - 0.5% ] 0.23% | 14,714,326 | 4.7% |
[ 0.0% - 0.5% ] 0.33% | 7,071,404 | 4.4% |
[ 0.0% - 0.5% ] 0.43% | 4,089,042 | 5.4% |
[ 0.5% - 1.0% ] 0.54% | 2,728,118 | 5.0% |
[ 0.5% - 1.0% ] 0.62% | 2,682,339 | 5.4% |
[ 0.5% - 1.0% ] 0.72% | 1,261,924 | 5.5% |
[ 0.5% - 1.0% ] 0.80% | 1,238,390 | 4.5% |
[ 0.5% - 1.0% ] 0.91% | 818,355 | 5.2% |
[ 1.0% - 1.5% ] 1.01% | 449,931 | 5.5% |
[ 1.0% - 1.5% ] 1.12% | 1,189,269 | 5.0% |
[ 1.0% - 1.5% ] 1.20% | 538,475 | 8.5% |
[ 1.0% - 1.5% ] 1.29% | 393,652 | 5.1% |
[ 1.0% - 1.5% ] 1.41% | 1,105,362 | 7.7% |
[ 1.5% - 2.0% ] 1.50% | 105,580 | 8.9% |
[ 1.5% - 2.0% ] 1.58% | 100,924 | 5.0% |
[ 1.5% - 2.0% ] 1.68% | 177,331 | 8.0% |
[ 1.5% - 2.0% ] 1.78% | 154,649 | 5.8% |
[ 1.5% - 2.0% ] 1.88% | 136,113 | 9.2% |
[ 1.5% - 2.0% ] 1.97% | 262,666 | 5.5% |
[ 2.0% - 2.5% ] 2.07% | 66,031 | 7.0% |
[ 2.0% - 2.5% ] 2.15% | 66,887 | 5.0% |
[ 2.0% - 2.5% ] 2.25% | 77,659 | 8.8% |
[ 2.0% - 2.5% ] 2.37% | 74,457 | 10.5% |
[ 2.0% - 2.5% ] 2.48% | 69,767 | 4.7% |
[ 2.5% - 3.0% ] 2.58% | 56,397 | 21.4% |
[ 2.5% - 3.0% ] 2.64% | 337,411 | 6.0% |
[ 2.5% - 3.0% ] 2.74% | 54,081 | 5.7% |
[ 2.5% - 3.0% ] 2.83% | 77,618 | 12.3% |
[ 2.5% - 3.0% ] 2.96% | 5,615 | 12.7% |
[ 3.0% - 3.5% ] 3.07% | 32,651 | 18.1% |
[ 3.0% - 3.5% ] 3.20% | 92,651 | 7.0% |
[ 3.0% - 3.5% ] 3.28% | 3,902 | 2.7% |
[ 3.0% - 3.5% ] 3.45% | 8,580 | 17.1% |
[ 3.0% - 3.5% ] 3.49% | 2,433 | 4.4% |
[ 3.5% - 4.0% ] 3.60% | 70,364 | 11.3% |
[ 3.5% - 4.0% ] 3.68% | 598 | 9.7% |
[ 3.5% - 4.0% ] 3.84% | 41,405 | 2.4% |
[ 3.5% - 4.0% ] 3.99% | 146,187 | 5.2% |
[ 4.0% - 4.5% ] 4.18% | 34,220 | 2.7% |
[ 4.0% - 4.5% ] 4.24% | 802 | 5.3% |
[ 4.5% - 5.0% ] 4.55% | 14,391 | 1.1% |
[ 4.5% - 5.0% ] 4.69% | 2,984 | 11.4% |
[ 4.5% - 5.0% ] 4.79% | 1,003 | 12.6% |
[ 5.0% - 5.5% ] 5.03% | 5,134 | 5.6% |
[ 5.0% - 5.5% ] 5.15% | 4,332 | 1.7% |
[ 5.0% - 5.5% ] 5.24% | 4,965 | 18.2% |
[ 5.0% - 5.5% ] 5.47% | 17,716 | 0.85% |
[ 5.5% - 6.0% ] 5.66% | 106 | 17.9% |
[ 6.0% - 6.5% ] 6.06% | 57,662 | 9.9% |
[ 6.0% - 6.5% ] 6.16% | 991 | 1.7% |
[ 6.0% - 6.5% ] 6.43% | 389 | 1.9% |
[ 6.5% - 7.0% ] 6.65% | 19,613 | 18.9% |
[ 6.5% - 7.0% ] 6.74% | 1,900 | 5.9% |
[ 7.0% - 7.5% ] 7.19% | 153 | 5.1% |
[ 8.5% - 9.0% ] 8.70% | 1,172 | 3.9% |
[ 9.5% - 10.0% ] 9.93% | 1,218 | 7.9% |
[ 11.5% - 12.0% ] 11.57% | 527 | 1.5% |
[ 16.0% - 16.5% ] 16.49% | 734 | 10.4% |