Immigrants from Laos Self-Care Disability
COMPARE
Immigrants from Laos
Select to Compare
Self-Care Disability
Immigrants from Laos Self-Care Disability
2.7%
SELF-CARE DISABILITY
0.1/ 100
METRIC RATING
272nd/ 347
METRIC RANK
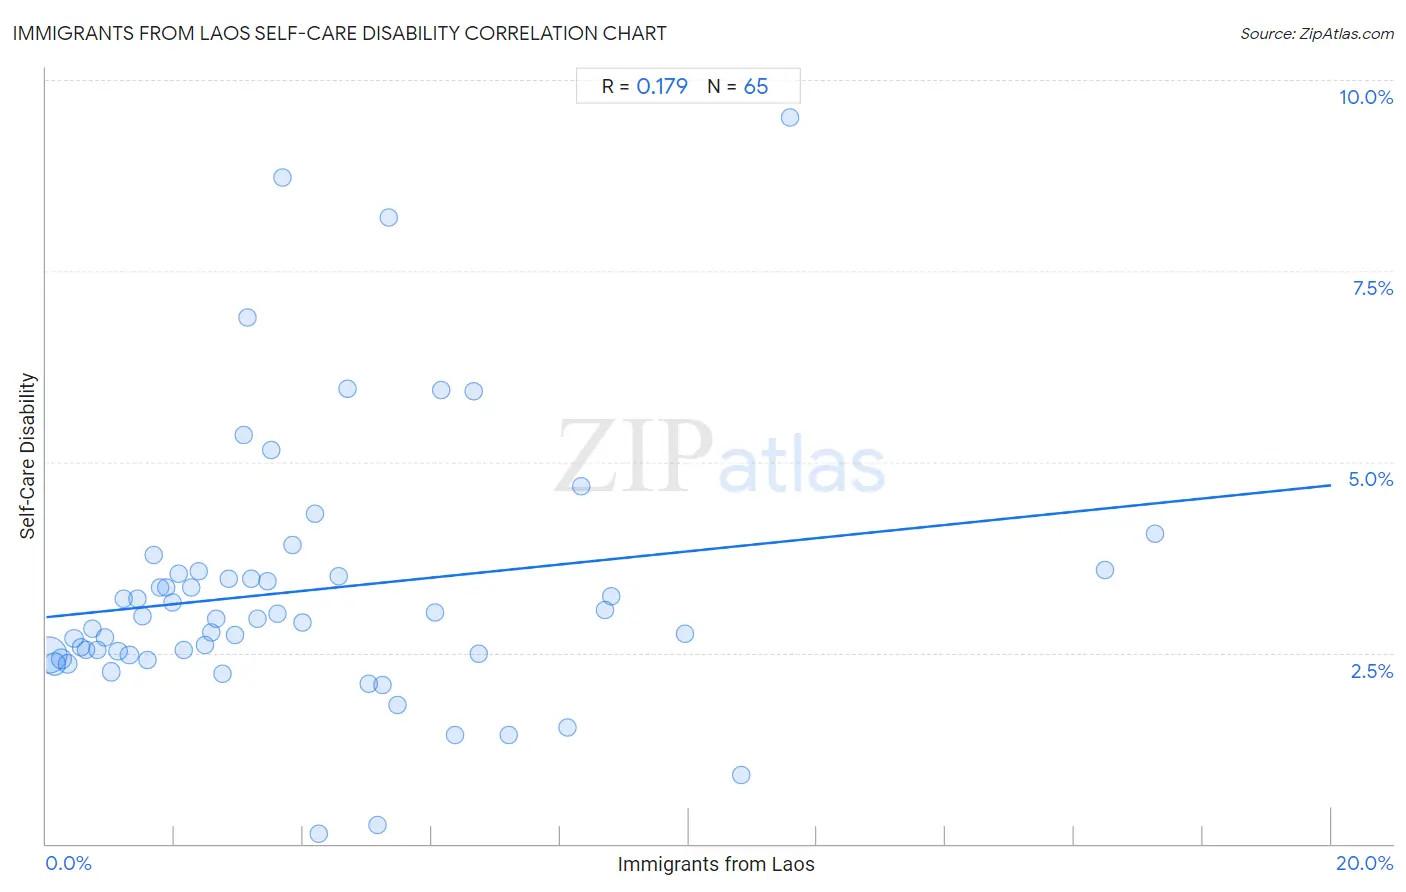
Immigrants from Laos Self-Care Disability Correlation Chart
The statistical analysis conducted on geographies consisting of 201,433,768 people shows a poor positive correlation between the proportion of Immigrants from Laos and percentage of population with self-care disability in the United States with a correlation coefficient (R) of 0.179 and weighted average of 2.7%. On average, for every 1% (one percent) increase in Immigrants from Laos within a typical geography, there is an increase of 0.086% in percentage of population with self-care disability.
It is essential to understand that the correlation between the percentage of Immigrants from Laos and percentage of population with self-care disability does not imply a direct cause-and-effect relationship. It remains uncertain whether the presence of Immigrants from Laos influences an upward or downward trend in the level of percentage of population with self-care disability within an area, or if Immigrants from Laos simply ended up residing in those areas with higher or lower levels of percentage of population with self-care disability due to other factors.
Demographics Similar to Immigrants from Laos by Self-Care Disability
In terms of self-care disability, the demographic groups most similar to Immigrants from Laos are Trinidadian and Tobagonian (2.7%, a difference of 0.040%), Immigrants from Micronesia (2.7%, a difference of 0.10%), Mexican (2.7%, a difference of 0.13%), U.S. Virgin Islander (2.7%, a difference of 0.14%), and Yakama (2.7%, a difference of 0.20%).
| Demographics | Rating | Rank | Self-Care Disability |
| Immigrants from Nicaragua | 0.2 /100 | #265 | Tragic 2.7% |
| Immigrants from Cambodia | 0.1 /100 | #266 | Tragic 2.7% |
| Yaqui | 0.1 /100 | #267 | Tragic 2.7% |
| Immigrants from Mexico | 0.1 /100 | #268 | Tragic 2.7% |
| U.S. Virgin Islanders | 0.1 /100 | #269 | Tragic 2.7% |
| Immigrants from Micronesia | 0.1 /100 | #270 | Tragic 2.7% |
| Trinidadians and Tobagonians | 0.1 /100 | #271 | Tragic 2.7% |
| Immigrants from Laos | 0.1 /100 | #272 | Tragic 2.7% |
| Mexicans | 0.1 /100 | #273 | Tragic 2.7% |
| Yakama | 0.1 /100 | #274 | Tragic 2.7% |
| Immigrants from Trinidad and Tobago | 0.1 /100 | #275 | Tragic 2.7% |
| Japanese | 0.1 /100 | #276 | Tragic 2.7% |
| Immigrants from Ukraine | 0.1 /100 | #277 | Tragic 2.7% |
| Ottawa | 0.1 /100 | #278 | Tragic 2.7% |
| Iroquois | 0.1 /100 | #279 | Tragic 2.7% |
Immigrants from Laos Self-Care Disability Correlation Summary
| Measurement | Immigrants from Laos Data | Self-Care Disability Data |
| Minimum | 0.032% | 0.13% |
| Maximum | 17.3% | 9.5% |
| Range | 17.2% | 9.4% |
| Mean | 4.1% | 3.3% |
| Median | 3.1% | 3.0% |
| Interquartile 25% (IQ1) | 1.5% | 2.5% |
| Interquartile 75% (IQ3) | 5.4% | 3.6% |
| Interquartile Range (IQR) | 3.9% | 1.1% |
| Standard Deviation (Sample) | 3.6% | 1.7% |
| Standard Deviation (Population) | 3.6% | 1.7% |
Correlation Details
| Immigrants from Laos Percentile | Sample Size | Self-Care Disability |
[ 0.0% - 0.5% ] 0.032% | 130,101,065 | 2.5% |
[ 0.0% - 0.5% ] 0.13% | 30,161,836 | 2.4% |
[ 0.0% - 0.5% ] 0.23% | 14,854,332 | 2.4% |
[ 0.0% - 0.5% ] 0.33% | 7,156,471 | 2.4% |
[ 0.0% - 0.5% ] 0.43% | 4,161,743 | 2.7% |
[ 0.5% - 1.0% ] 0.54% | 2,767,490 | 2.6% |
[ 0.5% - 1.0% ] 0.62% | 2,713,771 | 2.5% |
[ 0.5% - 1.0% ] 0.72% | 1,288,180 | 2.8% |
[ 0.5% - 1.0% ] 0.80% | 1,256,502 | 2.5% |
[ 0.5% - 1.0% ] 0.91% | 832,665 | 2.7% |
[ 1.0% - 1.5% ] 1.01% | 449,931 | 2.3% |
[ 1.0% - 1.5% ] 1.12% | 1,199,504 | 2.5% |
[ 1.0% - 1.5% ] 1.20% | 547,455 | 3.2% |
[ 1.0% - 1.5% ] 1.29% | 394,922 | 2.5% |
[ 1.0% - 1.5% ] 1.41% | 1,111,507 | 3.2% |
[ 1.5% - 2.0% ] 1.50% | 107,002 | 3.0% |
[ 1.5% - 2.0% ] 1.58% | 100,924 | 2.4% |
[ 1.5% - 2.0% ] 1.68% | 177,331 | 3.8% |
[ 1.5% - 2.0% ] 1.78% | 174,028 | 3.4% |
[ 1.5% - 2.0% ] 1.87% | 140,535 | 3.4% |
[ 1.5% - 2.0% ] 1.97% | 262,666 | 3.2% |
[ 2.0% - 2.5% ] 2.07% | 66,031 | 3.5% |
[ 2.0% - 2.5% ] 2.15% | 67,210 | 2.5% |
[ 2.0% - 2.5% ] 2.26% | 75,649 | 3.4% |
[ 2.0% - 2.5% ] 2.37% | 74,457 | 3.6% |
[ 2.0% - 2.5% ] 2.48% | 69,767 | 2.6% |
[ 2.5% - 3.0% ] 2.57% | 63,958 | 2.8% |
[ 2.5% - 3.0% ] 2.64% | 337,411 | 2.9% |
[ 2.5% - 3.0% ] 2.74% | 56,927 | 2.2% |
[ 2.5% - 3.0% ] 2.83% | 77,618 | 3.5% |
[ 2.5% - 3.0% ] 2.94% | 8,566 | 2.7% |
[ 3.0% - 3.5% ] 3.07% | 32,651 | 5.3% |
[ 3.0% - 3.5% ] 3.12% | 32 | 6.9% |
[ 3.0% - 3.5% ] 3.20% | 92,406 | 3.5% |
[ 3.0% - 3.5% ] 3.28% | 3,902 | 3.0% |
[ 3.0% - 3.5% ] 3.45% | 8,580 | 3.4% |
[ 3.0% - 3.5% ] 3.49% | 2,433 | 5.2% |
[ 3.5% - 4.0% ] 3.60% | 70,364 | 3.0% |
[ 3.5% - 4.0% ] 3.68% | 789 | 8.7% |
[ 3.5% - 4.0% ] 3.84% | 41,405 | 3.9% |
[ 3.5% - 4.0% ] 3.99% | 146,187 | 2.9% |
[ 4.0% - 4.5% ] 4.18% | 34,220 | 4.3% |
[ 4.0% - 4.5% ] 4.24% | 802 | 0.13% |
[ 4.5% - 5.0% ] 4.55% | 14,787 | 3.5% |
[ 4.5% - 5.0% ] 4.69% | 2,984 | 6.0% |
[ 5.0% - 5.5% ] 5.03% | 5,134 | 2.1% |
[ 5.0% - 5.5% ] 5.15% | 4,332 | 0.25% |
[ 5.0% - 5.5% ] 5.24% | 5,291 | 2.1% |
[ 5.0% - 5.5% ] 5.33% | 244 | 8.2% |
[ 5.0% - 5.5% ] 5.47% | 17,716 | 1.8% |
[ 6.0% - 6.5% ] 6.06% | 57,662 | 3.0% |
[ 6.0% - 6.5% ] 6.16% | 991 | 5.9% |
[ 6.0% - 6.5% ] 6.36% | 3,208 | 1.4% |
[ 6.5% - 7.0% ] 6.65% | 19,613 | 5.9% |
[ 6.5% - 7.0% ] 6.74% | 1,900 | 2.5% |
[ 7.0% - 7.5% ] 7.19% | 153 | 1.4% |
[ 8.0% - 8.5% ] 8.11% | 2,207 | 1.5% |
[ 8.0% - 8.5% ] 8.33% | 216 | 4.7% |
[ 8.5% - 9.0% ] 8.70% | 1,172 | 3.1% |
[ 8.5% - 9.0% ] 8.80% | 1,693 | 3.2% |
[ 9.5% - 10.0% ] 9.93% | 1,218 | 2.7% |
[ 10.5% - 11.0% ] 10.82% | 564 | 0.90% |
[ 11.5% - 12.0% ] 11.57% | 527 | 9.5% |
[ 16.0% - 16.5% ] 16.49% | 734 | 3.6% |
[ 17.0% - 17.5% ] 17.26% | 197 | 4.1% |