Immigrants from Laos Disability Age Under 5

COMPARE

Immigrants from Laos
Race
Ancestry
AfghanAfricanAlaska NativeAlaskan AthabascanAlbanianAleutAlsatianAmericanApacheArabArapahoArgentineanArmenianAssyrian/Chaldean/SyriacAustralianAustrianBahamianBangladeshiBarbadianBasqueBelgianBelizeanBermudanBhutaneseBlackfeetBolivianBrazilianBritishBritish West IndianBulgarianBurmeseCajunCambodianCanadianCape VerdeanCarpatho RusynCelticCentral AmericanCentral American IndianCherokeeCheyenneChickasawChileanChineseChippewaChoctawColombianColvilleComancheCosta RicanCreeCreekCroatianCrowCubanCypriotCzechCzechoslovakianDanishDelawareDominicanDutchDutch West IndianEastern EuropeanEcuadorianEgyptianEnglishEstonianEthiopianEuropeanFijianFilipinoFinnishFrenchFrench American IndianFrench CanadianGermanGerman RussianGhanaianGreekGuamanian/ChamorroGuatemalanGuyaneseHaitianHmongHonduranHopiHoumaHungarianIcelanderIndian (Asian)IndonesianInupiatIranianIraqiIrishIroquoisIsraeliItalianJamaicanJapaneseJordanianKenyanKiowaKoreanLaotianLatvianLebaneseLiberianLithuanianLumbeeLuxembourgerMacedonianMalaysianMalteseMarshalleseMenomineeMexicanMexican American IndianMongolianMoroccanNative HawaiianNavajoNepaleseNew ZealanderNicaraguanNigerianNorthern EuropeanNorwegianOkinawanOsageOttawaPaiutePakistaniPalestinianPanamanianParaguayanPennsylvania GermanPeruvianPimaPolishPortuguesePotawatomiPuebloPuerto RicanPuget Sound SalishRomanianRussianSalvadoranSamoanScandinavianScotch-IrishScottishSeminoleSenegaleseSerbianShoshoneSierra LeoneanSiouxSlavicSlovakSloveneSomaliSouth AfricanSouth AmericanSouth American IndianSoviet UnionSpaniardSpanishSpanish AmericanSpanish American IndianSri LankanSubsaharan AfricanSudaneseSwedishSwissSyrianTaiwaneseThaiTlingit-HaidaTohono O'OdhamTonganTrinidadian and TobagonianTsimshianTurkishU.S. Virgin IslanderUgandanUkrainianUruguayanUteVenezuelanVietnameseWelshWest IndianYakamaYaquiYugoslavianYumanYup'ikZimbabwean
Immigration
NonimmigrantsImmigrantsAfghanistanAfricaAlbaniaArgentinaArmeniaAsiaAustraliaAustriaBahamasBangladeshBarbadosBelarusBelgiumBelizeBoliviaBosnia and HerzegovinaBrazilBulgariaBurma/MyanmarCabo VerdeCambodiaCameroonCanadaCaribbeanCentral AmericaChileChinaColombiaCongoCosta RicaCroatiaCubaCzechoslovakiaDenmarkDominicaDominican RepublicEastern AfricaEastern AsiaEastern EuropeEcuadorEgyptEl SalvadorEnglandEritreaEthiopiaEuropeFijiFranceGermanyGhanaGreeceGrenadaGuatemalaGuyanaHaitiHondurasHong KongHungaryIndiaIndonesiaIranIraqIrelandIsraelItalyJamaicaJapanJordanKazakhstanKenyaKoreaKuwaitLaosLatin AmericaLatviaLebanonLiberiaLithuaniaMalaysiaMexicoMicronesiaMiddle AfricaMoldovaMoroccoNepalNetherlandsNicaraguaNigeriaNorth AmericaNorth MacedoniaNorthern AfricaNorthern EuropeNorwayOceaniaPakistanPanamaPeruPhilippinesPolandPortugalRomaniaRussiaSaudi ArabiaScotlandSenegalSerbiaSierra LeoneSingaporeSomaliaSouth AfricaSouth AmericaSouth Central AsiaSouth Eastern AsiaSouthern EuropeSpainSri LankaSt. Vincent and the GrenadinesSudanSwedenSwitzerlandSyriaTaiwanThailandTrinidad and TobagoTurkeyUgandaUkraineUruguayUzbekistanVenezuelaVietnamWest IndiesWestern AfricaWestern AsiaWestern EuropeYemenZaireZimbabweAzores
Select to Compare
Race
Ancestry
AfghanAfricanAlaska NativeAlaskan AthabascanAlbanianAleutAlsatianAmericanApacheArabArapahoArgentineanArmenianAssyrian/Chaldean/SyriacAustralianAustrianBahamianBangladeshiBarbadianBasqueBelgianBelizeanBermudanBhutaneseBlackfeetBolivianBrazilianBritishBritish West IndianBulgarianBurmeseCajunCambodianCanadianCape VerdeanCarpatho RusynCelticCentral AmericanCentral American IndianCherokeeCheyenneChickasawChileanChineseChippewaChoctawColombianColvilleComancheCosta RicanCreeCreekCroatianCrowCubanCypriotCzechCzechoslovakianDanishDelawareDominicanDutchDutch West IndianEastern EuropeanEcuadorianEgyptianEnglishEstonianEthiopianEuropeanFijianFilipinoFinnishFrenchFrench American IndianFrench CanadianGermanGerman RussianGhanaianGreekGuamanian/ChamorroGuatemalanGuyaneseHaitianHmongHonduranHopiHoumaHungarianIcelanderIndian (Asian)IndonesianInupiatIranianIraqiIrishIroquoisIsraeliItalianJamaicanJapaneseJordanianKenyanKiowaKoreanLaotianLatvianLebaneseLiberianLithuanianLumbeeLuxembourgerMacedonianMalaysianMalteseMarshalleseMenomineeMexicanMexican American IndianMongolianMoroccanNative HawaiianNavajoNepaleseNew ZealanderNicaraguanNigerianNorthern EuropeanNorwegianOkinawanOsageOttawaPaiutePakistaniPalestinianPanamanianParaguayanPennsylvania GermanPeruvianPimaPolishPortuguesePotawatomiPuebloPuerto RicanPuget Sound SalishRomanianRussianSalvadoranSamoanScandinavianScotch-IrishScottishSeminoleSenegaleseSerbianShoshoneSierra LeoneanSiouxSlavicSlovakSloveneSomaliSouth AfricanSouth AmericanSouth American IndianSoviet UnionSpaniardSpanishSpanish AmericanSpanish American IndianSri LankanSubsaharan AfricanSudaneseSwedishSwissSyrianTaiwaneseThaiTlingit-HaidaTohono O'OdhamTonganTrinidadian and TobagonianTsimshianTurkishU.S. Virgin IslanderUgandanUkrainianUruguayanUteVenezuelanVietnameseWelshWest IndianYakamaYaquiYugoslavianYumanYup'ikZimbabwean
Immigration
NonimmigrantsImmigrantsAfghanistanAfricaAlbaniaArgentinaArmeniaAsiaAustraliaAustriaBahamasBangladeshBarbadosBelarusBelgiumBelizeBoliviaBosnia and HerzegovinaBrazilBulgariaBurma/MyanmarCabo VerdeCambodiaCameroonCanadaCaribbeanCentral AmericaChileChinaColombiaCongoCosta RicaCroatiaCubaCzechoslovakiaDenmarkDominicaDominican RepublicEastern AfricaEastern AsiaEastern EuropeEcuadorEgyptEl SalvadorEnglandEritreaEthiopiaEuropeFijiFranceGermanyGhanaGreeceGrenadaGuatemalaGuyanaHaitiHondurasHong KongHungaryIndiaIndonesiaIranIraqIrelandIsraelItalyJamaicaJapanJordanKazakhstanKenyaKoreaKuwaitLatin AmericaLatviaLebanonLiberiaLithuaniaMalaysiaMexicoMicronesiaMiddle AfricaMoldovaMoroccoNepalNetherlandsNicaraguaNigeriaNorth AmericaNorth MacedoniaNorthern AfricaNorthern EuropeNorwayOceaniaPakistanPanamaPeruPhilippinesPolandPortugalRomaniaRussiaSaudi ArabiaScotlandSenegalSerbiaSierra LeoneSingaporeSomaliaSouth AfricaSouth AmericaSouth Central AsiaSouth Eastern AsiaSouthern EuropeSpainSri LankaSt. Vincent and the GrenadinesSudanSwedenSwitzerlandSyriaTaiwanThailandTrinidad and TobagoTurkeyUgandaUkraineUruguayUzbekistanVenezuelaVietnamWest IndiesWestern AfricaWestern AsiaWestern EuropeYemenZaireZimbabweAzores
Disability Age Under 5
Income
Poverty
Unemployment
Labor Participation
Family Structure
Vehicle Availability
Education Level
Disability

Immigrants from Laos Disability Age Under 5
Fair

1.3%
DISABILITY | AGE UNDER 5
36.6/ 100
METRIC RATING
190th/ 347
METRIC RANK

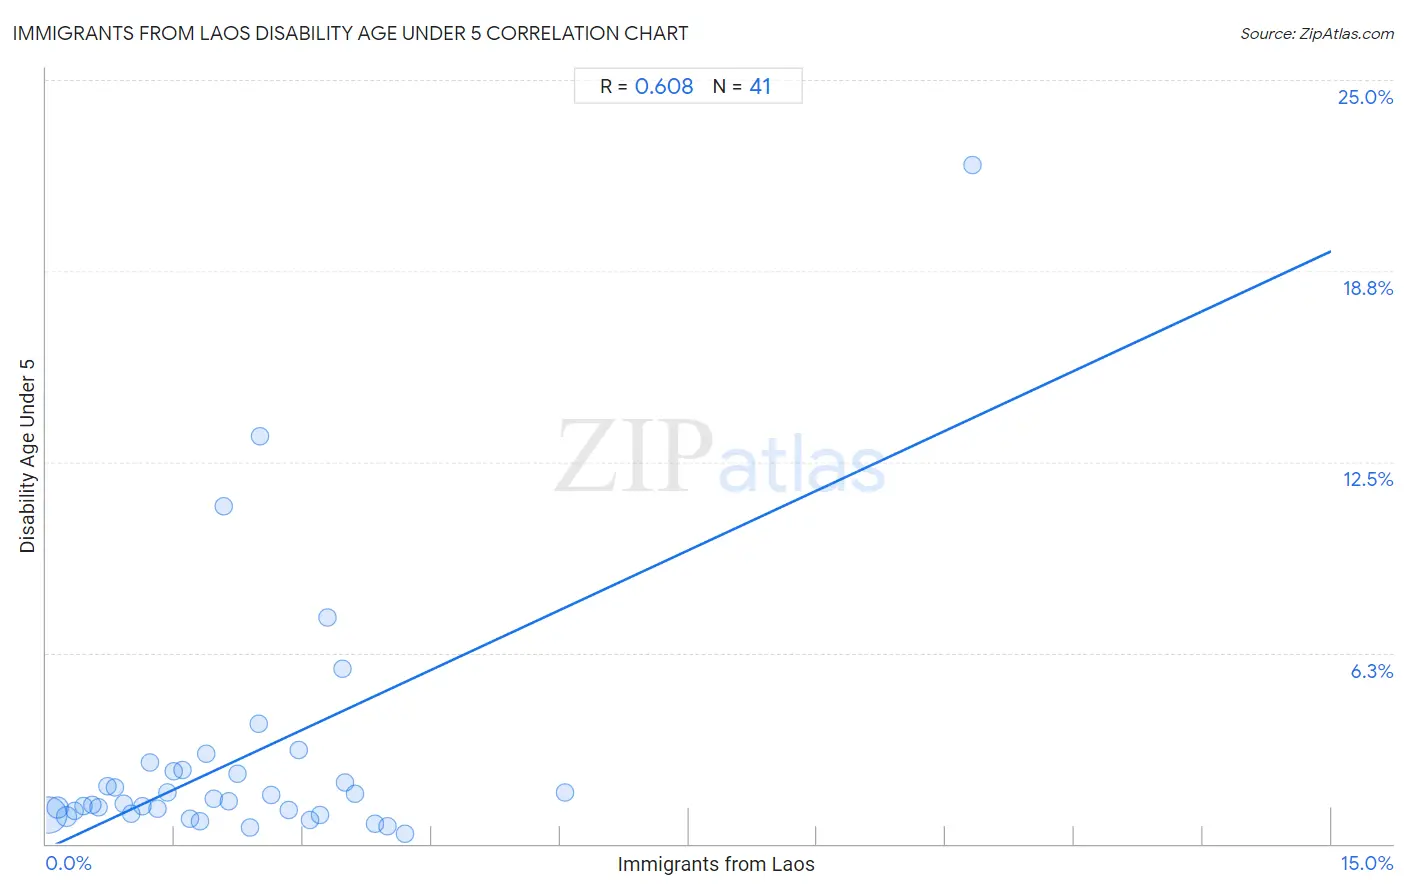
Immigrants from Laos Disability Age Under 5 Correlation Chart

The statistical analysis conducted on geographies consisting of 136,282,116 people shows a significant positive correlation between the proportion of Immigrants from Laos and percentage of population with a disability under the age of 5 in the United States with a correlation coefficient (R) of 0.608 and weighted average of 1.3%. On average, for every 1% (one percent) increase in Immigrants from Laos within a typical geography, there is an increase of 1.3% in percentage of population with a disability under the age of 5.
Immigrants from Laos Disability Age Under 5
It is essential to understand that the correlation between the percentage of Immigrants from Laos and percentage of population with a disability under the age of 5 does not imply a direct cause-and-effect relationship. It remains uncertain whether the presence of Immigrants from Laos influences an upward or downward trend in the level of percentage of population with a disability under the age of 5 within an area, or if Immigrants from Laos simply ended up residing in those areas with higher or lower levels of percentage of population with a disability under the age of 5 due to other factors.

Demographics Similar to Immigrants from Laos by Disability Age Under 5

In terms of disability age under 5, the demographic groups most similar to Immigrants from Laos are Mexican American Indian (1.3%, a difference of 0.010%), Immigrants from Bosnia and Herzegovina (1.3%, a difference of 0.010%), Immigrants from Sierra Leone (1.3%, a difference of 0.010%), Peruvian (1.3%, a difference of 0.090%), and Immigrants from North Macedonia (1.3%, a difference of 0.19%).
DemographicsRating | RankDisability Age Under 5
Immigrants from Saudi Arabia
43.3
/100
|
#183
Average
1.2%
Palestinians
43.0
/100
|
#184
Average
1.2%
Immigrants from Western Africa
42.5
/100
|
#185
Average
1.2%
Cubans
42.5
/100
|
#186
Average
1.2%
Immigrants from Haiti
40.2
/100
|
#187
Average
1.3%
Haitians
39.9
/100
|
#188
Fair
1.3%
Peruvians
37.6
/100
|
#189
Fair
1.3%
Immigrants from Laos
36.6
/100
|
#190
Fair
1.3%
Mexican American Indians
36.6
/100
|
#191
Fair
1.3%
Immigrants from Bosnia and Herzegovina
36.5
/100
|
#192
Fair
1.3%
Immigrants from Sierra Leone
36.5
/100
|
#193
Fair
1.3%
Immigrants from North Macedonia
34.7
/100
|
#194
Fair
1.3%
U.S. Virgin Islanders
34.4
/100
|
#195
Fair
1.3%
Immigrants from Belgium
31.4
/100
|
#196
Fair
1.3%
Immigrants from Somalia
31.3
/100
|
#197
Fair
1.3%

Immigrants from Laos Disability Age Under 5 Correlation Summary

MeasurementImmigrants from Laos DataDisability Age Under 5 Data
Minimum0.029%0.33%
Maximum10.8%22.2%
Range10.8%21.9%
Mean2.3%2.8%
Median2.0%1.4%
Interquartile 25% (IQ1)0.95%0.97%
Interquartile 75% (IQ3)3.1%2.4%
Interquartile Range (IQR)2.2%1.4%
Standard Deviation (Sample)1.9%4.1%
Standard Deviation (Population)1.9%4.0%

Correlation Details

Immigrants from Laos PercentileSample SizeDisability Age Under 5
[
0.0%
-
0.5%
]
0.029%
93,670,9920.92%
[
0.0%
-
0.5%
]
0.13%
18,007,7481.2%
[
0.0%
-
0.5%
]
0.24%
9,542,1210.90%
[
0.0%
-
0.5%
]
0.33%
3,913,3821.1%
[
0.0%
-
0.5%
]
0.43%
2,318,6731.2%
[
0.5%
-
1.0%
]
0.54%
1,410,7901.3%
[
0.5%
-
1.0%
]
0.62%
1,955,2591.2%
[
0.5%
-
1.0%
]
0.71%
664,0771.9%
[
0.5%
-
1.0%
]
0.80%
626,7681.8%
[
0.5%
-
1.0%
]
0.90%
268,9311.3%
[
0.5%
-
1.0%
]
0.99%
266,7490.99%
[
1.0%
-
1.5%
]
1.12%
838,1831.2%
[
1.0%
-
1.5%
]
1.21%
313,8002.7%
[
1.0%
-
1.5%
]
1.30%
200,8821.2%
[
1.0%
-
1.5%
]
1.42%
759,7861.7%
[
1.0%
-
1.5%
]
1.49%
41,8052.4%
[
1.5%
-
2.0%
]
1.59%
43,4272.4%
[
1.5%
-
2.0%
]
1.67%
143,3850.82%
[
1.5%
-
2.0%
]
1.80%
44,7900.73%
[
1.5%
-
2.0%
]
1.86%
36,7933.0%
[
1.5%
-
2.0%
]
1.96%
178,4011.5%
[
2.0%
-
2.5%
]
2.08%
5,20211.0%
[
2.0%
-
2.5%
]
2.13%
47,9781.4%
[
2.0%
-
2.5%
]
2.23%
32,6032.3%
[
2.0%
-
2.5%
]
2.38%
60,8500.53%
[
2.0%
-
2.5%
]
2.48%
52,8003.9%
[
2.0%
-
2.5%
]
2.50%
44013.3%
[
2.5%
-
3.0%
]
2.63%
308,8061.6%
[
2.5%
-
3.0%
]
2.82%
64,5731.1%
[
2.5%
-
3.0%
]
2.94%
3,6693.1%
[
3.0%
-
3.5%
]
3.07%
30,5560.79%
[
3.0%
-
3.5%
]
3.19%
82,1760.94%
[
3.0%
-
3.5%
]
3.28%
3,2647.4%
[
3.0%
-
3.5%
]
3.46%
7,5815.7%
[
3.0%
-
3.5%
]
3.48%
8612.0%
[
3.5%
-
4.0%
]
3.60%
59,7621.6%
[
3.5%
-
4.0%
]
3.84%
41,4050.66%
[
3.5%
-
4.0%
]
3.99%
140,4020.56%
[
4.0%
-
4.5%
]
4.18%
34,2200.33%
[
6.0%
-
6.5%
]
6.06%
57,6621.7%
[
10.5%
-
11.0%
]
10.82%
56422.2%