Immigrants from Japan Wage/Income Gap

COMPARE

Immigrants from Japan
Race
Ancestry
AfghanAfricanAlaska NativeAlaskan AthabascanAlbanianAleutAlsatianAmericanApacheArabArapahoArgentineanArmenianAssyrian/Chaldean/SyriacAustralianAustrianBahamianBangladeshiBarbadianBasqueBelgianBelizeanBermudanBhutaneseBlackfeetBolivianBrazilianBritishBritish West IndianBulgarianBurmeseCajunCambodianCanadianCape VerdeanCarpatho RusynCelticCentral AmericanCentral American IndianCherokeeCheyenneChickasawChileanChineseChippewaChoctawColombianColvilleComancheCosta RicanCreeCreekCroatianCrowCubanCypriotCzechCzechoslovakianDanishDelawareDominicanDutchDutch West IndianEastern EuropeanEcuadorianEgyptianEnglishEstonianEthiopianEuropeanFijianFilipinoFinnishFrenchFrench American IndianFrench CanadianGermanGerman RussianGhanaianGreekGuamanian/ChamorroGuatemalanGuyaneseHaitianHmongHonduranHopiHoumaHungarianIcelanderIndian (Asian)IndonesianInupiatIranianIraqiIrishIroquoisIsraeliItalianJamaicanJapaneseJordanianKenyanKiowaKoreanLaotianLatvianLebaneseLiberianLithuanianLumbeeLuxembourgerMacedonianMalaysianMalteseMarshalleseMenomineeMexicanMexican American IndianMongolianMoroccanNative HawaiianNavajoNepaleseNew ZealanderNicaraguanNigerianNorthern EuropeanNorwegianOkinawanOsageOttawaPaiutePakistaniPalestinianPanamanianParaguayanPennsylvania GermanPeruvianPimaPolishPortuguesePotawatomiPuebloPuerto RicanPuget Sound SalishRomanianRussianSalvadoranSamoanScandinavianScotch-IrishScottishSeminoleSenegaleseSerbianShoshoneSierra LeoneanSiouxSlavicSlovakSloveneSomaliSouth AfricanSouth AmericanSouth American IndianSoviet UnionSpaniardSpanishSpanish AmericanSpanish American IndianSri LankanSubsaharan AfricanSudaneseSwedishSwissSyrianTaiwaneseThaiTlingit-HaidaTohono O'OdhamTonganTrinidadian and TobagonianTsimshianTurkishU.S. Virgin IslanderUgandanUkrainianUruguayanUteVenezuelanVietnameseWelshWest IndianYakamaYaquiYugoslavianYumanYup'ikZimbabwean
Immigration
NonimmigrantsImmigrantsAfghanistanAfricaAlbaniaArgentinaArmeniaAsiaAustraliaAustriaBahamasBangladeshBarbadosBelarusBelgiumBelizeBoliviaBosnia and HerzegovinaBrazilBulgariaBurma/MyanmarCabo VerdeCambodiaCameroonCanadaCaribbeanCentral AmericaChileChinaColombiaCongoCosta RicaCroatiaCubaCzechoslovakiaDenmarkDominicaDominican RepublicEastern AfricaEastern AsiaEastern EuropeEcuadorEgyptEl SalvadorEnglandEritreaEthiopiaEuropeFijiFranceGermanyGhanaGreeceGrenadaGuatemalaGuyanaHaitiHondurasHong KongHungaryIndiaIndonesiaIranIraqIrelandIsraelItalyJamaicaJapanJordanKazakhstanKenyaKoreaKuwaitLaosLatin AmericaLatviaLebanonLiberiaLithuaniaMalaysiaMexicoMicronesiaMiddle AfricaMoldovaMoroccoNepalNetherlandsNicaraguaNigeriaNorth AmericaNorth MacedoniaNorthern AfricaNorthern EuropeNorwayOceaniaPakistanPanamaPeruPhilippinesPolandPortugalRomaniaRussiaSaudi ArabiaScotlandSenegalSerbiaSierra LeoneSingaporeSomaliaSouth AfricaSouth AmericaSouth Central AsiaSouth Eastern AsiaSouthern EuropeSpainSri LankaSt. Vincent and the GrenadinesSudanSwedenSwitzerlandSyriaTaiwanThailandTrinidad and TobagoTurkeyUgandaUkraineUruguayUzbekistanVenezuelaVietnamWest IndiesWestern AfricaWestern AsiaWestern EuropeYemenZaireZimbabweAzores
Select to Compare
Race
Ancestry
AfghanAfricanAlaska NativeAlaskan AthabascanAlbanianAleutAlsatianAmericanApacheArabArapahoArgentineanArmenianAssyrian/Chaldean/SyriacAustralianAustrianBahamianBangladeshiBarbadianBasqueBelgianBelizeanBermudanBhutaneseBlackfeetBolivianBrazilianBritishBritish West IndianBulgarianBurmeseCajunCambodianCanadianCape VerdeanCarpatho RusynCelticCentral AmericanCentral American IndianCherokeeCheyenneChickasawChileanChineseChippewaChoctawColombianColvilleComancheCosta RicanCreeCreekCroatianCrowCubanCypriotCzechCzechoslovakianDanishDelawareDominicanDutchDutch West IndianEastern EuropeanEcuadorianEgyptianEnglishEstonianEthiopianEuropeanFijianFilipinoFinnishFrenchFrench American IndianFrench CanadianGermanGerman RussianGhanaianGreekGuamanian/ChamorroGuatemalanGuyaneseHaitianHmongHonduranHopiHoumaHungarianIcelanderIndian (Asian)IndonesianInupiatIranianIraqiIrishIroquoisIsraeliItalianJamaicanJapaneseJordanianKenyanKiowaKoreanLaotianLatvianLebaneseLiberianLithuanianLumbeeLuxembourgerMacedonianMalaysianMalteseMarshalleseMenomineeMexicanMexican American IndianMongolianMoroccanNative HawaiianNavajoNepaleseNew ZealanderNicaraguanNigerianNorthern EuropeanNorwegianOkinawanOsageOttawaPaiutePakistaniPalestinianPanamanianParaguayanPennsylvania GermanPeruvianPimaPolishPortuguesePotawatomiPuebloPuerto RicanPuget Sound SalishRomanianRussianSalvadoranSamoanScandinavianScotch-IrishScottishSeminoleSenegaleseSerbianShoshoneSierra LeoneanSiouxSlavicSlovakSloveneSomaliSouth AfricanSouth AmericanSouth American IndianSoviet UnionSpaniardSpanishSpanish AmericanSpanish American IndianSri LankanSubsaharan AfricanSudaneseSwedishSwissSyrianTaiwaneseThaiTlingit-HaidaTohono O'OdhamTonganTrinidadian and TobagonianTsimshianTurkishU.S. Virgin IslanderUgandanUkrainianUruguayanUteVenezuelanVietnameseWelshWest IndianYakamaYaquiYugoslavianYumanYup'ikZimbabwean
Immigration
NonimmigrantsImmigrantsAfghanistanAfricaAlbaniaArgentinaArmeniaAsiaAustraliaAustriaBahamasBangladeshBarbadosBelarusBelgiumBelizeBoliviaBosnia and HerzegovinaBrazilBulgariaBurma/MyanmarCabo VerdeCambodiaCameroonCanadaCaribbeanCentral AmericaChileChinaColombiaCongoCosta RicaCroatiaCubaCzechoslovakiaDenmarkDominicaDominican RepublicEastern AfricaEastern AsiaEastern EuropeEcuadorEgyptEl SalvadorEnglandEritreaEthiopiaEuropeFijiFranceGermanyGhanaGreeceGrenadaGuatemalaGuyanaHaitiHondurasHong KongHungaryIndiaIndonesiaIranIraqIrelandIsraelItalyJamaicaJordanKazakhstanKenyaKoreaKuwaitLaosLatin AmericaLatviaLebanonLiberiaLithuaniaMalaysiaMexicoMicronesiaMiddle AfricaMoldovaMoroccoNepalNetherlandsNicaraguaNigeriaNorth AmericaNorth MacedoniaNorthern AfricaNorthern EuropeNorwayOceaniaPakistanPanamaPeruPhilippinesPolandPortugalRomaniaRussiaSaudi ArabiaScotlandSenegalSerbiaSierra LeoneSingaporeSomaliaSouth AfricaSouth AmericaSouth Central AsiaSouth Eastern AsiaSouthern EuropeSpainSri LankaSt. Vincent and the GrenadinesSudanSwedenSwitzerlandSyriaTaiwanThailandTrinidad and TobagoTurkeyUgandaUkraineUruguayUzbekistanVenezuelaVietnamWest IndiesWestern AfricaWestern AsiaWestern EuropeYemenZaireZimbabweAzores
Wage/Income Gap
Income
Poverty
Unemployment
Labor Participation
Family Structure
Vehicle Availability
Education Level
Disability

Immigrants from Japan Wage/Income Gap
Tragic

27.9%
WAGE/INCOME GAP
0.7/ 100
METRIC RATING
275th/ 347
METRIC RANK

Immigrants from Japan Wage/Income Gap Correlation Chart

The statistical analysis conducted on geographies consisting of 339,998,398 people shows a significant positive correlation between the proportion of Immigrants from Japan and wage/income gap percentage in the United States with a correlation coefficient (R) of 0.671 and weighted average of 27.9%. On average, for every 1% (one percent) increase in Immigrants from Japan within a typical geography, there is an increase of 1.6% in wage/income gap percentage.
Immigrants from Japan Wage/Income Gap
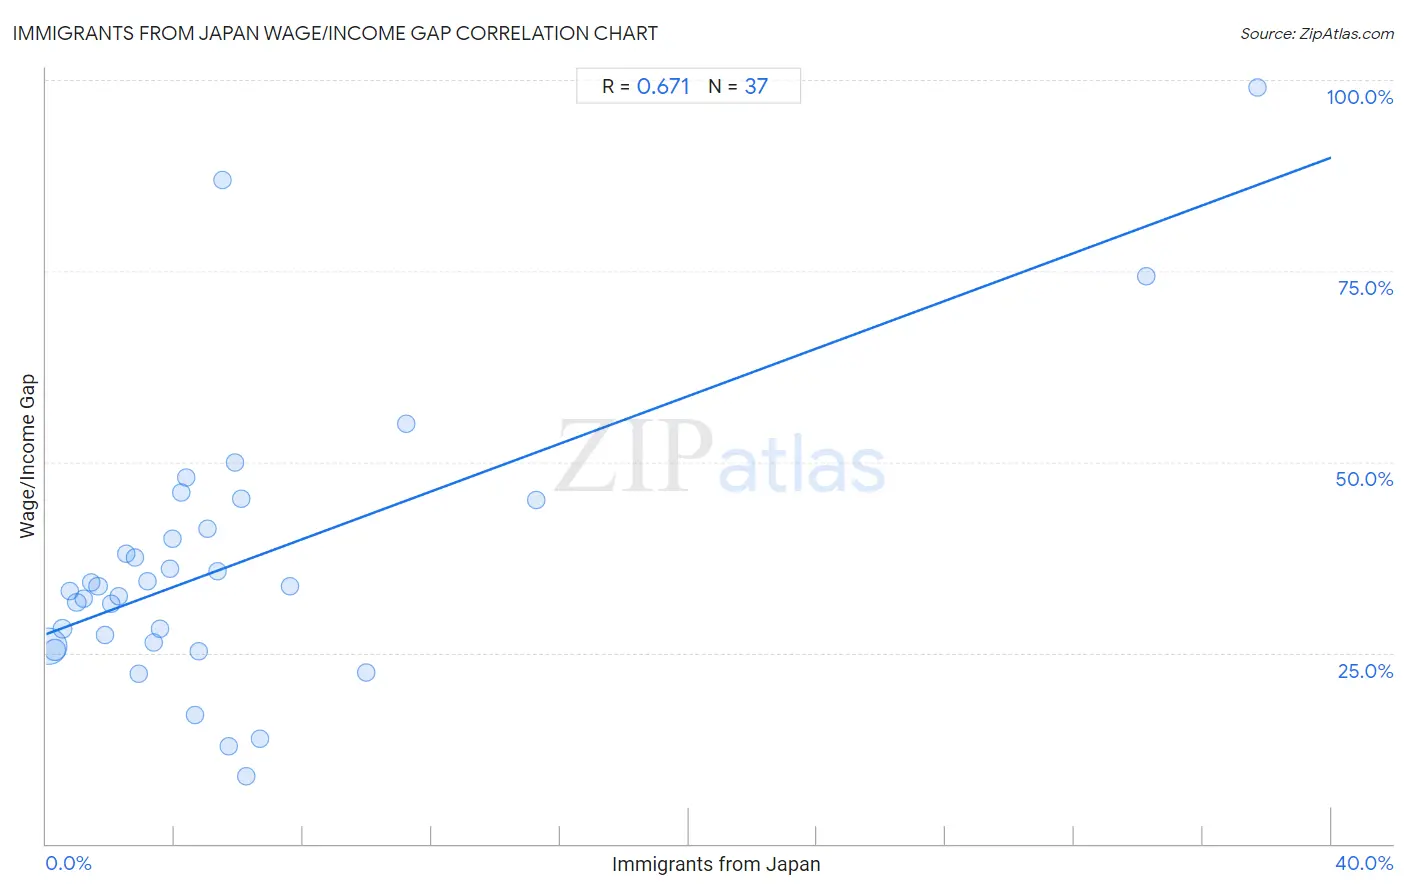
It is essential to understand that the correlation between the percentage of Immigrants from Japan and wage/income gap percentage does not imply a direct cause-and-effect relationship. It remains uncertain whether the presence of Immigrants from Japan influences an upward or downward trend in the level of wage/income gap percentage within an area, or if Immigrants from Japan simply ended up residing in those areas with higher or lower levels of wage/income gap percentage due to other factors.

Demographics Similar to Immigrants from Japan by Wage/Income Gap

In terms of wage/income gap, the demographic groups most similar to Immigrants from Japan are Lebanese (27.9%, a difference of 0.030%), Latvian (27.9%, a difference of 0.030%), American (27.8%, a difference of 0.080%), Immigrants from England (27.9%, a difference of 0.11%), and Bulgarian (27.8%, a difference of 0.12%).
DemographicsRating | RankWage/Income Gap
New Zealanders
1.0
/100
|
#268
Tragic
27.7%
Potawatomi
0.9
/100
|
#269
Tragic
27.7%
Immigrants from Western Europe
0.9
/100
|
#270
Tragic
27.8%
Ute
0.8
/100
|
#271
Tragic
27.8%
Immigrants from Korea
0.8
/100
|
#272
Tragic
27.8%
Bulgarians
0.7
/100
|
#273
Tragic
27.8%
Americans
0.7
/100
|
#274
Tragic
27.8%
Immigrants from Japan
0.7
/100
|
#275
Tragic
27.9%
Lebanese
0.7
/100
|
#276
Tragic
27.9%
Latvians
0.7
/100
|
#277
Tragic
27.9%
Immigrants from England
0.6
/100
|
#278
Tragic
27.9%
Romanians
0.5
/100
|
#279
Tragic
28.0%
Russians
0.5
/100
|
#280
Tragic
28.0%
Burmese
0.5
/100
|
#281
Tragic
28.0%
South Africans
0.5
/100
|
#282
Tragic
28.0%

Immigrants from Japan Wage/Income Gap Correlation Summary

MeasurementImmigrants from Japan DataWage/Income Gap Data
Minimum0.077%8.9%
Maximum37.7%99.0%
Range37.6%90.1%
Mean5.9%36.7%
Median3.9%33.6%
Interquartile 25% (IQ1)1.9%26.1%
Interquartile 75% (IQ3)6.0%43.1%
Interquartile Range (IQR)4.1%17.0%
Standard Deviation (Sample)7.9%18.4%
Standard Deviation (Population)7.8%18.2%

Correlation Details

Immigrants from Japan PercentileSample SizeWage/Income Gap
[
0.0%
-
0.5%
]
0.077%
253,914,98825.9%
[
0.0%
-
0.5%
]
0.28%
53,780,96025.3%
[
0.5%
-
1.0%
]
0.51%
16,869,93428.1%
[
0.5%
-
1.0%
]
0.75%
5,430,02733.1%
[
0.5%
-
1.0%
]
0.95%
3,155,44331.6%
[
1.0%
-
1.5%
]
1.17%
1,519,44532.1%
[
1.0%
-
1.5%
]
1.40%
1,777,13334.3%
[
1.5%
-
2.0%
]
1.61%
822,72933.7%
[
1.5%
-
2.0%
]
1.84%
471,78227.3%
[
2.0%
-
2.5%
]
2.04%
254,76531.4%
[
2.0%
-
2.5%
]
2.27%
193,13832.5%
[
2.0%
-
2.5%
]
2.48%
95,17137.9%
[
2.5%
-
3.0%
]
2.75%
76,33837.4%
[
2.5%
-
3.0%
]
2.89%
179,67122.3%
[
3.0%
-
3.5%
]
3.14%
72,18434.4%
[
3.0%
-
3.5%
]
3.36%
708,96926.3%
[
3.5%
-
4.0%
]
3.55%
166,36128.1%
[
3.5%
-
4.0%
]
3.87%
28,78836.1%
[
3.5%
-
4.0%
]
3.92%
34,87940.0%
[
4.0%
-
4.5%
]
4.22%
74,18846.0%
[
4.0%
-
4.5%
]
4.36%
4,26647.9%
[
4.5%
-
5.0%
]
4.63%
30,69716.8%
[
4.5%
-
5.0%
]
4.74%
202,38325.2%
[
5.0%
-
5.5%
]
5.01%
36,93141.2%
[
5.0%
-
5.5%
]
5.32%
13,35235.6%
[
5.0%
-
5.5%
]
5.48%
45686.9%
[
5.5%
-
6.0%
]
5.69%
70312.8%
[
5.5%
-
6.0%
]
5.89%
54350.0%
[
6.0%
-
6.5%
]
6.09%
46045.2%
[
6.0%
-
6.5%
]
6.24%
4818.9%
[
6.5%
-
7.0%
]
6.66%
7,28013.8%
[
7.5%
-
8.0%
]
7.59%
44,15233.6%
[
9.5%
-
10.0%
]
9.98%
27,01022.4%
[
11.0%
-
11.5%
]
11.21%
69655.1%
[
15.0%
-
15.5%
]
15.27%
1,69045.0%
[
34.0%
-
34.5%
]
34.23%
22274.3%
[
37.5%
-
38.0%
]
37.70%
18399.0%