Immigrants from Japan Self-Care Disability
COMPARE
Immigrants from Japan
Select to Compare
Self-Care Disability
Immigrants from Japan Self-Care Disability
2.3%
SELF-CARE DISABILITY
99.5/ 100
METRIC RATING
60th/ 347
METRIC RANK
Immigrants from Japan Self-Care Disability Correlation Chart
The statistical analysis conducted on geographies consisting of 339,768,160 people shows a significant positive correlation between the proportion of Immigrants from Japan and percentage of population with self-care disability in the United States with a correlation coefficient (R) of 0.697 and weighted average of 2.3%. On average, for every 1% (one percent) increase in Immigrants from Japan within a typical geography, there is an increase of 0.55% in percentage of population with self-care disability.
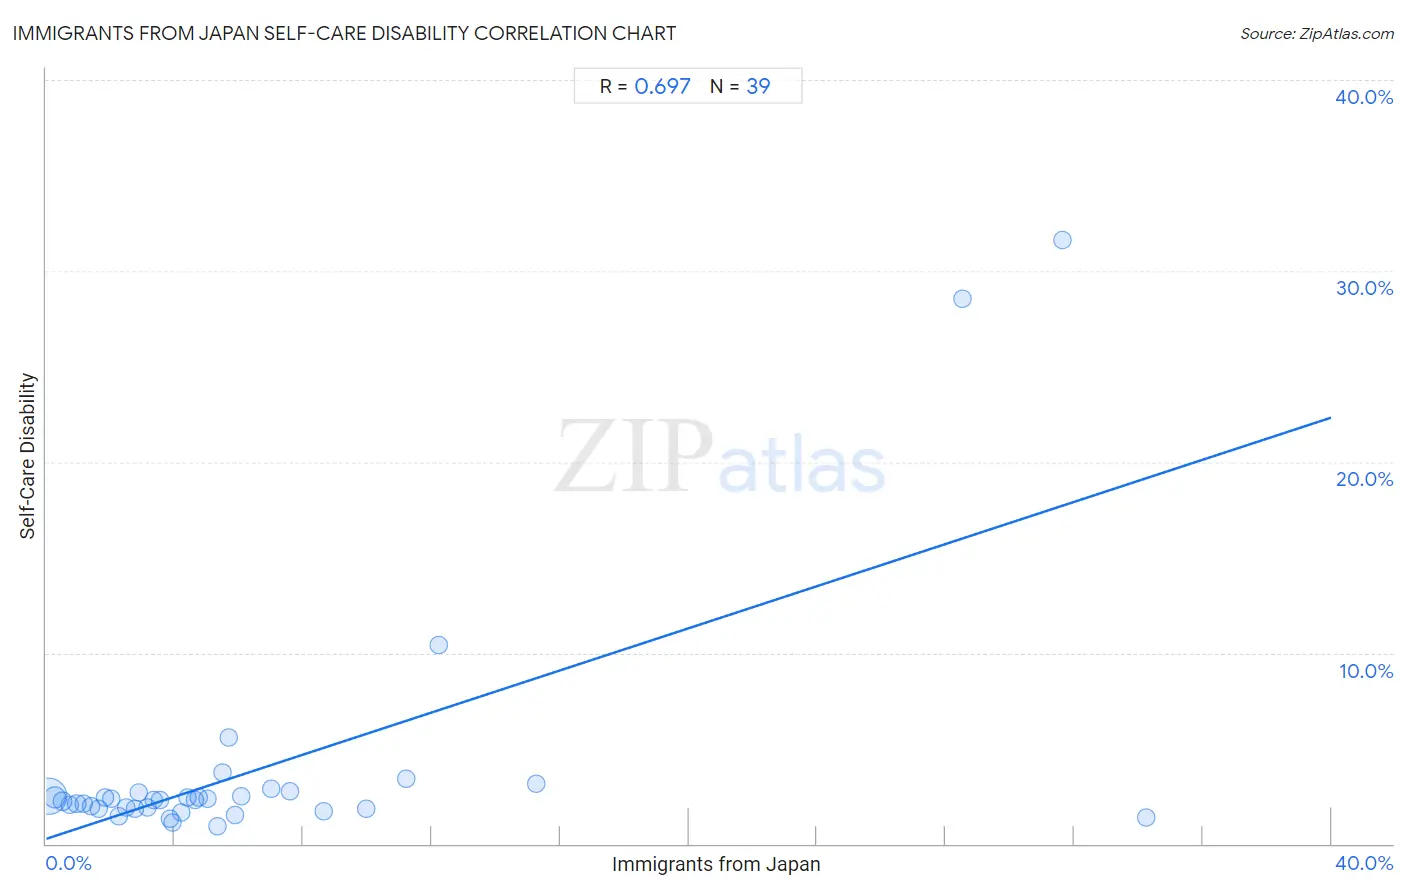
It is essential to understand that the correlation between the percentage of Immigrants from Japan and percentage of population with self-care disability does not imply a direct cause-and-effect relationship. It remains uncertain whether the presence of Immigrants from Japan influences an upward or downward trend in the level of percentage of population with self-care disability within an area, or if Immigrants from Japan simply ended up residing in those areas with higher or lower levels of percentage of population with self-care disability due to other factors.
Demographics Similar to Immigrants from Japan by Self-Care Disability
In terms of self-care disability, the demographic groups most similar to Immigrants from Japan are Palestinian (2.3%, a difference of 0.10%), New Zealander (2.3%, a difference of 0.14%), Egyptian (2.3%, a difference of 0.19%), Immigrants from Cameroon (2.3%, a difference of 0.25%), and Mongolian (2.3%, a difference of 0.27%).
| Demographics | Rating | Rank | Self-Care Disability |
| Australians | 99.6 /100 | #53 | Exceptional 2.3% |
| Argentineans | 99.6 /100 | #54 | Exceptional 2.3% |
| Immigrants from France | 99.6 /100 | #55 | Exceptional 2.3% |
| Immigrants from Eastern Asia | 99.6 /100 | #56 | Exceptional 2.3% |
| Immigrants from Belgium | 99.6 /100 | #57 | Exceptional 2.3% |
| Immigrants from Cameroon | 99.6 /100 | #58 | Exceptional 2.3% |
| New Zealanders | 99.5 /100 | #59 | Exceptional 2.3% |
| Immigrants from Japan | 99.5 /100 | #60 | Exceptional 2.3% |
| Palestinians | 99.4 /100 | #61 | Exceptional 2.3% |
| Egyptians | 99.4 /100 | #62 | Exceptional 2.3% |
| Mongolians | 99.3 /100 | #63 | Exceptional 2.3% |
| Swedes | 99.3 /100 | #64 | Exceptional 2.3% |
| Brazilians | 99.3 /100 | #65 | Exceptional 2.3% |
| Immigrants from Argentina | 99.3 /100 | #66 | Exceptional 2.3% |
| South Africans | 99.3 /100 | #67 | Exceptional 2.3% |
Immigrants from Japan Self-Care Disability Correlation Summary
| Measurement | Immigrants from Japan Data | Self-Care Disability Data |
| Minimum | 0.077% | 0.90% |
| Maximum | 34.2% | 31.6% |
| Range | 34.2% | 30.7% |
| Mean | 6.6% | 3.9% |
| Median | 4.2% | 2.3% |
| Interquartile 25% (IQ1) | 2.0% | 1.8% |
| Interquartile 75% (IQ3) | 7.0% | 2.7% |
| Interquartile Range (IQR) | 5.0% | 0.86% |
| Standard Deviation (Sample) | 8.0% | 6.4% |
| Standard Deviation (Population) | 7.9% | 6.3% |
Correlation Details
| Immigrants from Japan Percentile | Sample Size | Self-Care Disability |
[ 0.0% - 0.5% ] 0.077% | 253,813,200 | 2.5% |
[ 0.0% - 0.5% ] 0.28% | 53,751,296 | 2.4% |
[ 0.5% - 1.0% ] 0.51% | 16,819,482 | 2.2% |
[ 0.5% - 1.0% ] 0.75% | 5,412,470 | 2.1% |
[ 0.5% - 1.0% ] 0.95% | 3,147,185 | 2.1% |
[ 1.0% - 1.5% ] 1.17% | 1,526,266 | 2.1% |
[ 1.0% - 1.5% ] 1.40% | 1,763,010 | 1.9% |
[ 1.5% - 2.0% ] 1.61% | 825,086 | 1.8% |
[ 1.5% - 2.0% ] 1.84% | 467,732 | 2.4% |
[ 2.0% - 2.5% ] 2.04% | 254,246 | 2.3% |
[ 2.0% - 2.5% ] 2.27% | 192,152 | 1.5% |
[ 2.0% - 2.5% ] 2.48% | 96,289 | 1.9% |
[ 2.5% - 3.0% ] 2.75% | 74,911 | 1.9% |
[ 2.5% - 3.0% ] 2.89% | 179,045 | 2.7% |
[ 3.0% - 3.5% ] 3.14% | 67,385 | 1.9% |
[ 3.0% - 3.5% ] 3.36% | 708,757 | 2.3% |
[ 3.5% - 4.0% ] 3.55% | 167,928 | 2.3% |
[ 3.5% - 4.0% ] 3.87% | 29,784 | 1.3% |
[ 3.5% - 4.0% ] 3.92% | 34,755 | 1.1% |
[ 4.0% - 4.5% ] 4.22% | 75,182 | 1.6% |
[ 4.0% - 4.5% ] 4.40% | 432 | 2.4% |
[ 4.5% - 5.0% ] 4.63% | 30,697 | 2.3% |
[ 4.5% - 5.0% ] 4.74% | 202,903 | 2.4% |
[ 5.0% - 5.5% ] 5.01% | 36,715 | 2.4% |
[ 5.0% - 5.5% ] 5.32% | 13,751 | 0.90% |
[ 5.0% - 5.5% ] 5.48% | 493 | 3.7% |
[ 5.5% - 6.0% ] 5.69% | 703 | 5.6% |
[ 5.5% - 6.0% ] 5.89% | 543 | 1.5% |
[ 6.0% - 6.5% ] 6.09% | 460 | 2.5% |
[ 7.0% - 7.5% ] 7.01% | 157 | 2.9% |
[ 7.5% - 8.0% ] 7.59% | 44,152 | 2.8% |
[ 8.5% - 9.0% ] 8.62% | 348 | 1.7% |
[ 9.5% - 10.0% ] 9.98% | 27,010 | 1.8% |
[ 11.0% - 11.5% ] 11.21% | 696 | 3.4% |
[ 12.0% - 12.5% ] 12.23% | 327 | 10.4% |
[ 15.0% - 15.5% ] 15.27% | 1,690 | 3.1% |
[ 28.5% - 29.0% ] 28.53% | 368 | 28.5% |
[ 31.5% - 32.0% ] 31.63% | 332 | 31.6% |
[ 34.0% - 34.5% ] 34.23% | 222 | 1.4% |