Immigrants from Japan Married-Couple Family Poverty

COMPARE

Immigrants from Japan
Race
Ancestry
AfghanAfricanAlaska NativeAlaskan AthabascanAlbanianAleutAlsatianAmericanApacheArabArapahoArgentineanArmenianAssyrian/Chaldean/SyriacAustralianAustrianBahamianBangladeshiBarbadianBasqueBelgianBelizeanBermudanBhutaneseBlackfeetBolivianBrazilianBritishBritish West IndianBulgarianBurmeseCajunCambodianCanadianCape VerdeanCarpatho RusynCelticCentral AmericanCentral American IndianCherokeeCheyenneChickasawChileanChineseChippewaChoctawColombianColvilleComancheCosta RicanCreeCreekCroatianCrowCubanCypriotCzechCzechoslovakianDanishDelawareDominicanDutchDutch West IndianEastern EuropeanEcuadorianEgyptianEnglishEstonianEthiopianEuropeanFijianFilipinoFinnishFrenchFrench American IndianFrench CanadianGermanGerman RussianGhanaianGreekGuamanian/ChamorroGuatemalanGuyaneseHaitianHmongHonduranHopiHoumaHungarianIcelanderIndian (Asian)IndonesianInupiatIranianIraqiIrishIroquoisIsraeliItalianJamaicanJapaneseJordanianKenyanKiowaKoreanLaotianLatvianLebaneseLiberianLithuanianLumbeeLuxembourgerMacedonianMalaysianMalteseMarshalleseMenomineeMexicanMexican American IndianMongolianMoroccanNative HawaiianNavajoNepaleseNew ZealanderNicaraguanNigerianNorthern EuropeanNorwegianOkinawanOsageOttawaPaiutePakistaniPalestinianPanamanianParaguayanPennsylvania GermanPeruvianPimaPolishPortuguesePotawatomiPuebloPuerto RicanPuget Sound SalishRomanianRussianSalvadoranSamoanScandinavianScotch-IrishScottishSeminoleSenegaleseSerbianShoshoneSierra LeoneanSiouxSlavicSlovakSloveneSomaliSouth AfricanSouth AmericanSouth American IndianSoviet UnionSpaniardSpanishSpanish AmericanSpanish American IndianSri LankanSubsaharan AfricanSudaneseSwedishSwissSyrianTaiwaneseThaiTlingit-HaidaTohono O'OdhamTonganTrinidadian and TobagonianTsimshianTurkishU.S. Virgin IslanderUgandanUkrainianUruguayanUteVenezuelanVietnameseWelshWest IndianYakamaYaquiYugoslavianYumanYup'ikZimbabwean
Immigration
NonimmigrantsImmigrantsAfghanistanAfricaAlbaniaArgentinaArmeniaAsiaAustraliaAustriaBahamasBangladeshBarbadosBelarusBelgiumBelizeBoliviaBosnia and HerzegovinaBrazilBulgariaBurma/MyanmarCabo VerdeCambodiaCameroonCanadaCaribbeanCentral AmericaChileChinaColombiaCongoCosta RicaCroatiaCubaCzechoslovakiaDenmarkDominicaDominican RepublicEastern AfricaEastern AsiaEastern EuropeEcuadorEgyptEl SalvadorEnglandEritreaEthiopiaEuropeFijiFranceGermanyGhanaGreeceGrenadaGuatemalaGuyanaHaitiHondurasHong KongHungaryIndiaIndonesiaIranIraqIrelandIsraelItalyJamaicaJapanJordanKazakhstanKenyaKoreaKuwaitLaosLatin AmericaLatviaLebanonLiberiaLithuaniaMalaysiaMexicoMicronesiaMiddle AfricaMoldovaMoroccoNepalNetherlandsNicaraguaNigeriaNorth AmericaNorth MacedoniaNorthern AfricaNorthern EuropeNorwayOceaniaPakistanPanamaPeruPhilippinesPolandPortugalRomaniaRussiaSaudi ArabiaScotlandSenegalSerbiaSierra LeoneSingaporeSomaliaSouth AfricaSouth AmericaSouth Central AsiaSouth Eastern AsiaSouthern EuropeSpainSri LankaSt. Vincent and the GrenadinesSudanSwedenSwitzerlandSyriaTaiwanThailandTrinidad and TobagoTurkeyUgandaUkraineUruguayUzbekistanVenezuelaVietnamWest IndiesWestern AfricaWestern AsiaWestern EuropeYemenZaireZimbabweAzores
Select to Compare
Race
Ancestry
AfghanAfricanAlaska NativeAlaskan AthabascanAlbanianAleutAlsatianAmericanApacheArabArapahoArgentineanArmenianAssyrian/Chaldean/SyriacAustralianAustrianBahamianBangladeshiBarbadianBasqueBelgianBelizeanBermudanBhutaneseBlackfeetBolivianBrazilianBritishBritish West IndianBulgarianBurmeseCajunCambodianCanadianCape VerdeanCarpatho RusynCelticCentral AmericanCentral American IndianCherokeeCheyenneChickasawChileanChineseChippewaChoctawColombianColvilleComancheCosta RicanCreeCreekCroatianCrowCubanCypriotCzechCzechoslovakianDanishDelawareDominicanDutchDutch West IndianEastern EuropeanEcuadorianEgyptianEnglishEstonianEthiopianEuropeanFijianFilipinoFinnishFrenchFrench American IndianFrench CanadianGermanGerman RussianGhanaianGreekGuamanian/ChamorroGuatemalanGuyaneseHaitianHmongHonduranHopiHoumaHungarianIcelanderIndian (Asian)IndonesianInupiatIranianIraqiIrishIroquoisIsraeliItalianJamaicanJapaneseJordanianKenyanKiowaKoreanLaotianLatvianLebaneseLiberianLithuanianLumbeeLuxembourgerMacedonianMalaysianMalteseMarshalleseMenomineeMexicanMexican American IndianMongolianMoroccanNative HawaiianNavajoNepaleseNew ZealanderNicaraguanNigerianNorthern EuropeanNorwegianOkinawanOsageOttawaPaiutePakistaniPalestinianPanamanianParaguayanPennsylvania GermanPeruvianPimaPolishPortuguesePotawatomiPuebloPuerto RicanPuget Sound SalishRomanianRussianSalvadoranSamoanScandinavianScotch-IrishScottishSeminoleSenegaleseSerbianShoshoneSierra LeoneanSiouxSlavicSlovakSloveneSomaliSouth AfricanSouth AmericanSouth American IndianSoviet UnionSpaniardSpanishSpanish AmericanSpanish American IndianSri LankanSubsaharan AfricanSudaneseSwedishSwissSyrianTaiwaneseThaiTlingit-HaidaTohono O'OdhamTonganTrinidadian and TobagonianTsimshianTurkishU.S. Virgin IslanderUgandanUkrainianUruguayanUteVenezuelanVietnameseWelshWest IndianYakamaYaquiYugoslavianYumanYup'ikZimbabwean
Immigration
NonimmigrantsImmigrantsAfghanistanAfricaAlbaniaArgentinaArmeniaAsiaAustraliaAustriaBahamasBangladeshBarbadosBelarusBelgiumBelizeBoliviaBosnia and HerzegovinaBrazilBulgariaBurma/MyanmarCabo VerdeCambodiaCameroonCanadaCaribbeanCentral AmericaChileChinaColombiaCongoCosta RicaCroatiaCubaCzechoslovakiaDenmarkDominicaDominican RepublicEastern AfricaEastern AsiaEastern EuropeEcuadorEgyptEl SalvadorEnglandEritreaEthiopiaEuropeFijiFranceGermanyGhanaGreeceGrenadaGuatemalaGuyanaHaitiHondurasHong KongHungaryIndiaIndonesiaIranIraqIrelandIsraelItalyJamaicaJordanKazakhstanKenyaKoreaKuwaitLaosLatin AmericaLatviaLebanonLiberiaLithuaniaMalaysiaMexicoMicronesiaMiddle AfricaMoldovaMoroccoNepalNetherlandsNicaraguaNigeriaNorth AmericaNorth MacedoniaNorthern AfricaNorthern EuropeNorwayOceaniaPakistanPanamaPeruPhilippinesPolandPortugalRomaniaRussiaSaudi ArabiaScotlandSenegalSerbiaSierra LeoneSingaporeSomaliaSouth AfricaSouth AmericaSouth Central AsiaSouth Eastern AsiaSouthern EuropeSpainSri LankaSt. Vincent and the GrenadinesSudanSwedenSwitzerlandSyriaTaiwanThailandTrinidad and TobagoTurkeyUgandaUkraineUruguayUzbekistanVenezuelaVietnamWest IndiesWestern AfricaWestern AsiaWestern EuropeYemenZaireZimbabweAzores
Married-Couple Family Poverty
Income
Poverty
Unemployment
Labor Participation
Family Structure
Vehicle Availability
Education Level
Disability

Immigrants from Japan Married-Couple Family Poverty
Exceptional

4.3%
POVERTY | MARRIED-COUPLE FAMILIES
99.8/ 100
METRIC RATING
44th/ 347
METRIC RANK

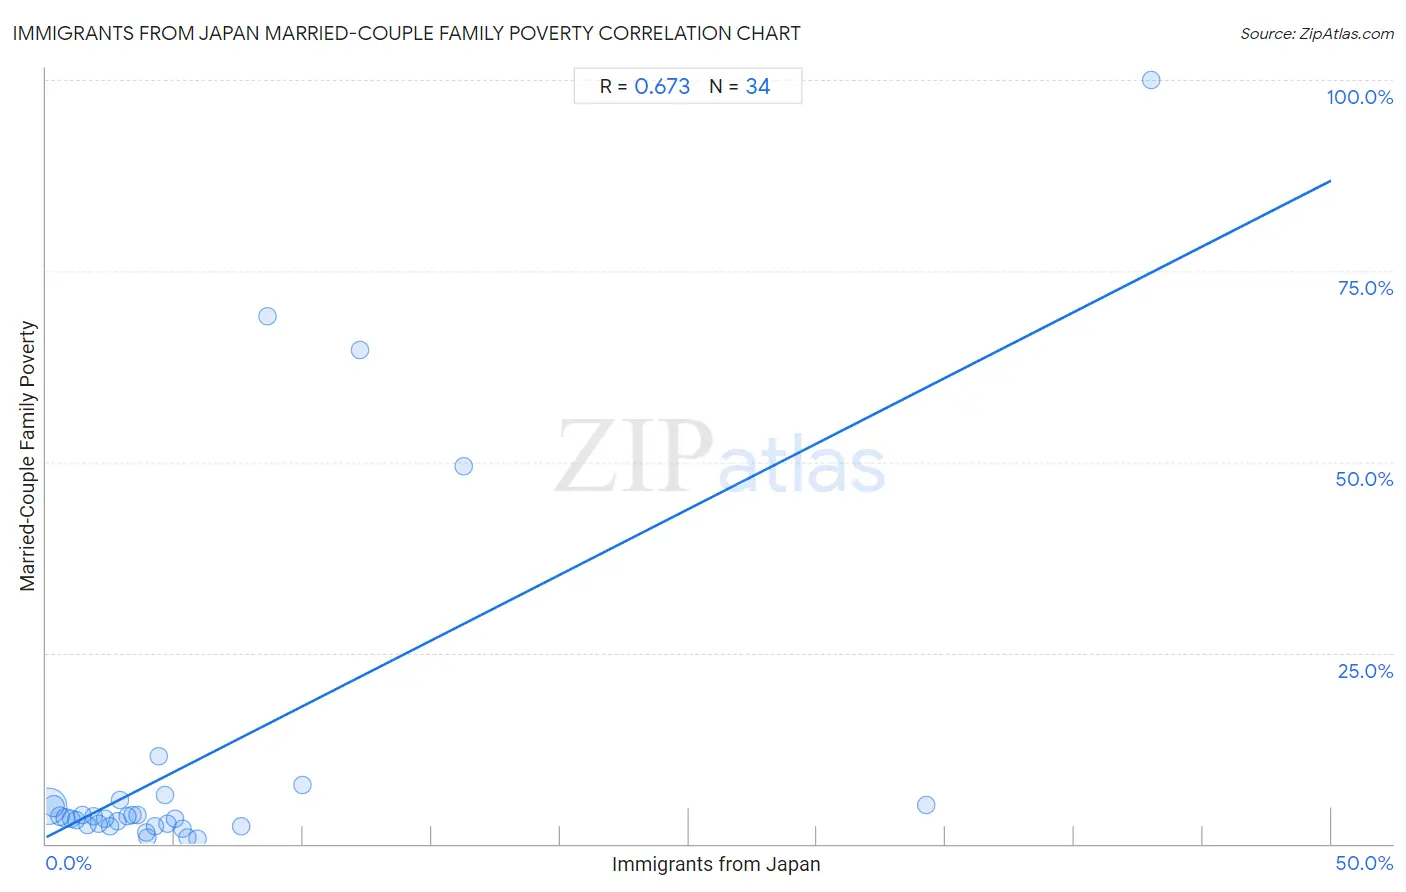
Immigrants from Japan Married-Couple Family Poverty Correlation Chart

The statistical analysis conducted on geographies consisting of 337,873,757 people shows a significant positive correlation between the proportion of Immigrants from Japan and poverty level among married-couple families in the United States with a correlation coefficient (R) of 0.673 and weighted average of 4.3%. On average, for every 1% (one percent) increase in Immigrants from Japan within a typical geography, there is an increase of 1.7% in poverty level among married-couple families.
Immigrants from Japan Married-Couple Family Poverty
It is essential to understand that the correlation between the percentage of Immigrants from Japan and poverty level among married-couple families does not imply a direct cause-and-effect relationship. It remains uncertain whether the presence of Immigrants from Japan influences an upward or downward trend in the level of poverty level among married-couple families within an area, or if Immigrants from Japan simply ended up residing in those areas with higher or lower levels of poverty level among married-couple families due to other factors.

Demographics Similar to Immigrants from Japan by Married-Couple Family Poverty

In terms of married-couple family poverty, the demographic groups most similar to Immigrants from Japan are Serbian (4.3%, a difference of 0.020%), British (4.3%, a difference of 0.050%), Immigrants from South Central Asia (4.3%, a difference of 0.16%), Australian (4.3%, a difference of 0.23%), and Turkish (4.3%, a difference of 0.31%).
DemographicsRating | RankMarried-Couple Family Poverty
Iranians
99.9
/100
|
#37
Exceptional
4.2%
Belgians
99.9
/100
|
#38
Exceptional
4.2%
Immigrants from Northern Europe
99.8
/100
|
#39
Exceptional
4.2%
French Canadians
99.8
/100
|
#40
Exceptional
4.2%
Northern Europeans
99.8
/100
|
#41
Exceptional
4.3%
Scottish
99.8
/100
|
#42
Exceptional
4.3%
Swiss
99.8
/100
|
#43
Exceptional
4.3%
Immigrants from Japan
99.8
/100
|
#44
Exceptional
4.3%
Serbians
99.8
/100
|
#45
Exceptional
4.3%
British
99.8
/100
|
#46
Exceptional
4.3%
Immigrants from South Central Asia
99.8
/100
|
#47
Exceptional
4.3%
Australians
99.7
/100
|
#48
Exceptional
4.3%
Turks
99.7
/100
|
#49
Exceptional
4.3%
Burmese
99.7
/100
|
#50
Exceptional
4.3%
Immigrants from Lithuania
99.7
/100
|
#51
Exceptional
4.3%

Immigrants from Japan Married-Couple Family Poverty Correlation Summary

MeasurementImmigrants from Japan DataMarried-Couple Family Poverty Data
Minimum0.077%0.67%
Maximum43.0%100.0%
Range42.9%99.3%
Mean6.2%11.5%
Median3.7%3.5%
Interquartile 25% (IQ1)1.8%2.5%
Interquartile 75% (IQ3)5.5%5.0%
Interquartile Range (IQR)3.6%2.5%
Standard Deviation (Sample)9.0%23.0%
Standard Deviation (Population)8.9%22.6%

Correlation Details

Immigrants from Japan PercentileSample SizeMarried-Couple Family Poverty
[
0.0%
-
0.5%
]
0.077%
252,942,3135.0%
[
0.0%
-
0.5%
]
0.28%
53,258,5995.0%
[
0.5%
-
1.0%
]
0.51%
16,656,3423.6%
[
0.5%
-
1.0%
]
0.75%
5,333,0873.4%
[
0.5%
-
1.0%
]
0.95%
3,091,1863.3%
[
1.0%
-
1.5%
]
1.17%
1,442,0443.1%
[
1.0%
-
1.5%
]
1.40%
1,743,4543.7%
[
1.5%
-
2.0%
]
1.62%
801,7772.5%
[
1.5%
-
2.0%
]
1.84%
458,9053.6%
[
2.0%
-
2.5%
]
2.04%
235,3772.6%
[
2.0%
-
2.5%
]
2.27%
187,9133.3%
[
2.5%
-
3.0%
]
2.50%
76,9502.3%
[
2.5%
-
3.0%
]
2.75%
64,7893.0%
[
2.5%
-
3.0%
]
2.89%
160,9605.7%
[
3.0%
-
3.5%
]
3.14%
63,7383.6%
[
3.0%
-
3.5%
]
3.36%
706,1293.8%
[
3.5%
-
4.0%
]
3.55%
163,3733.8%
[
3.5%
-
4.0%
]
3.87%
28,7881.5%
[
3.5%
-
4.0%
]
3.92%
30,7520.77%
[
4.0%
-
4.5%
]
4.22%
72,5902.4%
[
4.0%
-
4.5%
]
4.38%
36511.4%
[
4.5%
-
5.0%
]
4.63%
30,0686.4%
[
4.5%
-
5.0%
]
4.74%
202,9032.7%
[
5.0%
-
5.5%
]
5.01%
36,7153.2%
[
5.0%
-
5.5%
]
5.32%
13,5581.9%
[
5.0%
-
5.5%
]
5.48%
4560.75%
[
5.5%
-
6.0%
]
5.89%
5430.67%
[
7.5%
-
8.0%
]
7.59%
41,8062.4%
[
8.5%
-
9.0%
]
8.62%
34869.1%
[
9.5%
-
10.0%
]
9.98%
27,0107.7%
[
12.0%
-
12.5%
]
12.23%
32764.6%
[
16.0%
-
16.5%
]
16.25%
27749.5%
[
34.0%
-
34.5%
]
34.23%
2225.0%
[
43.0%
-
43.5%
]
43.01%
93100.0%