Immigrants from Japan Disability

COMPARE

Immigrants from Japan
Race
Ancestry
AfghanAfricanAlaska NativeAlaskan AthabascanAlbanianAleutAlsatianAmericanApacheArabArapahoArgentineanArmenianAssyrian/Chaldean/SyriacAustralianAustrianBahamianBangladeshiBarbadianBasqueBelgianBelizeanBermudanBhutaneseBlackfeetBolivianBrazilianBritishBritish West IndianBulgarianBurmeseCajunCambodianCanadianCape VerdeanCarpatho RusynCelticCentral AmericanCentral American IndianCherokeeCheyenneChickasawChileanChineseChippewaChoctawColombianColvilleComancheCosta RicanCreeCreekCroatianCrowCubanCypriotCzechCzechoslovakianDanishDelawareDominicanDutchDutch West IndianEastern EuropeanEcuadorianEgyptianEnglishEstonianEthiopianEuropeanFijianFilipinoFinnishFrenchFrench American IndianFrench CanadianGermanGerman RussianGhanaianGreekGuamanian/ChamorroGuatemalanGuyaneseHaitianHmongHonduranHopiHoumaHungarianIcelanderIndian (Asian)IndonesianInupiatIranianIraqiIrishIroquoisIsraeliItalianJamaicanJapaneseJordanianKenyanKiowaKoreanLaotianLatvianLebaneseLiberianLithuanianLumbeeLuxembourgerMacedonianMalaysianMalteseMarshalleseMenomineeMexicanMexican American IndianMongolianMoroccanNative HawaiianNavajoNepaleseNew ZealanderNicaraguanNigerianNorthern EuropeanNorwegianOkinawanOsageOttawaPaiutePakistaniPalestinianPanamanianParaguayanPennsylvania GermanPeruvianPimaPolishPortuguesePotawatomiPuebloPuerto RicanPuget Sound SalishRomanianRussianSalvadoranSamoanScandinavianScotch-IrishScottishSeminoleSenegaleseSerbianShoshoneSierra LeoneanSiouxSlavicSlovakSloveneSomaliSouth AfricanSouth AmericanSouth American IndianSoviet UnionSpaniardSpanishSpanish AmericanSpanish American IndianSri LankanSubsaharan AfricanSudaneseSwedishSwissSyrianTaiwaneseThaiTlingit-HaidaTohono O'OdhamTonganTrinidadian and TobagonianTsimshianTurkishU.S. Virgin IslanderUgandanUkrainianUruguayanUteVenezuelanVietnameseWelshWest IndianYakamaYaquiYugoslavianYumanYup'ikZimbabwean
Immigration
NonimmigrantsImmigrantsAfghanistanAfricaAlbaniaArgentinaArmeniaAsiaAustraliaAustriaBahamasBangladeshBarbadosBelarusBelgiumBelizeBoliviaBosnia and HerzegovinaBrazilBulgariaBurma/MyanmarCabo VerdeCambodiaCameroonCanadaCaribbeanCentral AmericaChileChinaColombiaCongoCosta RicaCroatiaCubaCzechoslovakiaDenmarkDominicaDominican RepublicEastern AfricaEastern AsiaEastern EuropeEcuadorEgyptEl SalvadorEnglandEritreaEthiopiaEuropeFijiFranceGermanyGhanaGreeceGrenadaGuatemalaGuyanaHaitiHondurasHong KongHungaryIndiaIndonesiaIranIraqIrelandIsraelItalyJamaicaJapanJordanKazakhstanKenyaKoreaKuwaitLaosLatin AmericaLatviaLebanonLiberiaLithuaniaMalaysiaMexicoMicronesiaMiddle AfricaMoldovaMoroccoNepalNetherlandsNicaraguaNigeriaNorth AmericaNorth MacedoniaNorthern AfricaNorthern EuropeNorwayOceaniaPakistanPanamaPeruPhilippinesPolandPortugalRomaniaRussiaSaudi ArabiaScotlandSenegalSerbiaSierra LeoneSingaporeSomaliaSouth AfricaSouth AmericaSouth Central AsiaSouth Eastern AsiaSouthern EuropeSpainSri LankaSt. Vincent and the GrenadinesSudanSwedenSwitzerlandSyriaTaiwanThailandTrinidad and TobagoTurkeyUgandaUkraineUruguayUzbekistanVenezuelaVietnamWest IndiesWestern AfricaWestern AsiaWestern EuropeYemenZaireZimbabweAzores
Select to Compare
Race
Ancestry
AfghanAfricanAlaska NativeAlaskan AthabascanAlbanianAleutAlsatianAmericanApacheArabArapahoArgentineanArmenianAssyrian/Chaldean/SyriacAustralianAustrianBahamianBangladeshiBarbadianBasqueBelgianBelizeanBermudanBhutaneseBlackfeetBolivianBrazilianBritishBritish West IndianBulgarianBurmeseCajunCambodianCanadianCape VerdeanCarpatho RusynCelticCentral AmericanCentral American IndianCherokeeCheyenneChickasawChileanChineseChippewaChoctawColombianColvilleComancheCosta RicanCreeCreekCroatianCrowCubanCypriotCzechCzechoslovakianDanishDelawareDominicanDutchDutch West IndianEastern EuropeanEcuadorianEgyptianEnglishEstonianEthiopianEuropeanFijianFilipinoFinnishFrenchFrench American IndianFrench CanadianGermanGerman RussianGhanaianGreekGuamanian/ChamorroGuatemalanGuyaneseHaitianHmongHonduranHopiHoumaHungarianIcelanderIndian (Asian)IndonesianInupiatIranianIraqiIrishIroquoisIsraeliItalianJamaicanJapaneseJordanianKenyanKiowaKoreanLaotianLatvianLebaneseLiberianLithuanianLumbeeLuxembourgerMacedonianMalaysianMalteseMarshalleseMenomineeMexicanMexican American IndianMongolianMoroccanNative HawaiianNavajoNepaleseNew ZealanderNicaraguanNigerianNorthern EuropeanNorwegianOkinawanOsageOttawaPaiutePakistaniPalestinianPanamanianParaguayanPennsylvania GermanPeruvianPimaPolishPortuguesePotawatomiPuebloPuerto RicanPuget Sound SalishRomanianRussianSalvadoranSamoanScandinavianScotch-IrishScottishSeminoleSenegaleseSerbianShoshoneSierra LeoneanSiouxSlavicSlovakSloveneSomaliSouth AfricanSouth AmericanSouth American IndianSoviet UnionSpaniardSpanishSpanish AmericanSpanish American IndianSri LankanSubsaharan AfricanSudaneseSwedishSwissSyrianTaiwaneseThaiTlingit-HaidaTohono O'OdhamTonganTrinidadian and TobagonianTsimshianTurkishU.S. Virgin IslanderUgandanUkrainianUruguayanUteVenezuelanVietnameseWelshWest IndianYakamaYaquiYugoslavianYumanYup'ikZimbabwean
Immigration
NonimmigrantsImmigrantsAfghanistanAfricaAlbaniaArgentinaArmeniaAsiaAustraliaAustriaBahamasBangladeshBarbadosBelarusBelgiumBelizeBoliviaBosnia and HerzegovinaBrazilBulgariaBurma/MyanmarCabo VerdeCambodiaCameroonCanadaCaribbeanCentral AmericaChileChinaColombiaCongoCosta RicaCroatiaCubaCzechoslovakiaDenmarkDominicaDominican RepublicEastern AfricaEastern AsiaEastern EuropeEcuadorEgyptEl SalvadorEnglandEritreaEthiopiaEuropeFijiFranceGermanyGhanaGreeceGrenadaGuatemalaGuyanaHaitiHondurasHong KongHungaryIndiaIndonesiaIranIraqIrelandIsraelItalyJamaicaJordanKazakhstanKenyaKoreaKuwaitLaosLatin AmericaLatviaLebanonLiberiaLithuaniaMalaysiaMexicoMicronesiaMiddle AfricaMoldovaMoroccoNepalNetherlandsNicaraguaNigeriaNorth AmericaNorth MacedoniaNorthern AfricaNorthern EuropeNorwayOceaniaPakistanPanamaPeruPhilippinesPolandPortugalRomaniaRussiaSaudi ArabiaScotlandSenegalSerbiaSierra LeoneSingaporeSomaliaSouth AfricaSouth AmericaSouth Central AsiaSouth Eastern AsiaSouthern EuropeSpainSri LankaSt. Vincent and the GrenadinesSudanSwedenSwitzerlandSyriaTaiwanThailandTrinidad and TobagoTurkeyUgandaUkraineUruguayUzbekistanVenezuelaVietnamWest IndiesWestern AfricaWestern AsiaWestern EuropeYemenZaireZimbabweAzores
Disability
Income
Poverty
Unemployment
Labor Participation
Family Structure
Vehicle Availability
Education Level
Disability

Immigrants from Japan Disability
Exceptional

10.8%
DISABILITY
99.9/ 100
METRIC RATING
44th/ 347
METRIC RANK

Immigrants from Japan Disability Correlation Chart

The statistical analysis conducted on geographies consisting of 340,149,948 people shows a moderate positive correlation between the proportion of Immigrants from Japan and percentage of population with a disability in the United States with a correlation coefficient (R) of 0.438 and weighted average of 10.8%. On average, for every 1% (one percent) increase in Immigrants from Japan within a typical geography, there is an increase of 0.42% in percentage of population with a disability.
Immigrants from Japan Disability
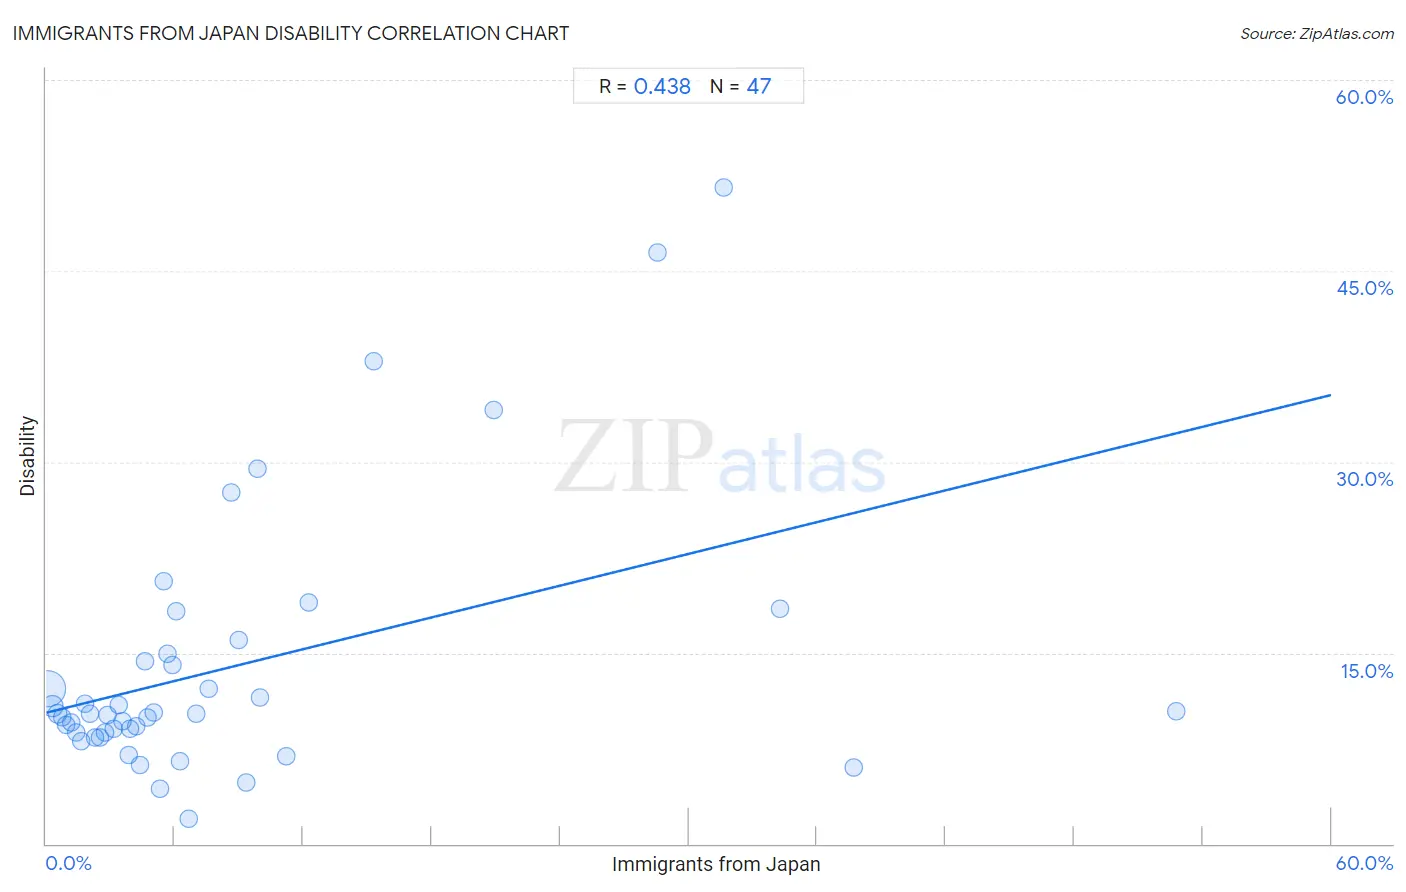
It is essential to understand that the correlation between the percentage of Immigrants from Japan and percentage of population with a disability does not imply a direct cause-and-effect relationship. It remains uncertain whether the presence of Immigrants from Japan influences an upward or downward trend in the level of percentage of population with a disability within an area, or if Immigrants from Japan simply ended up residing in those areas with higher or lower levels of percentage of population with a disability due to other factors.

Demographics Similar to Immigrants from Japan by Disability

In terms of disability, the demographic groups most similar to Immigrants from Japan are Israeli (10.8%, a difference of 0.10%), Immigrants from Nepal (10.8%, a difference of 0.15%), Immigrants from Australia (10.8%, a difference of 0.25%), Cambodian (10.8%, a difference of 0.29%), and Mongolian (10.8%, a difference of 0.29%).
DemographicsRating | RankDisability
Turks
100.0
/100
|
#37
Exceptional
10.7%
Afghans
99.9
/100
|
#38
Exceptional
10.8%
Cambodians
99.9
/100
|
#39
Exceptional
10.8%
Mongolians
99.9
/100
|
#40
Exceptional
10.8%
Immigrants from Australia
99.9
/100
|
#41
Exceptional
10.8%
Immigrants from Nepal
99.9
/100
|
#42
Exceptional
10.8%
Israelis
99.9
/100
|
#43
Exceptional
10.8%
Immigrants from Japan
99.9
/100
|
#44
Exceptional
10.8%
Immigrants from Peru
99.9
/100
|
#45
Exceptional
10.8%
Tongans
99.9
/100
|
#46
Exceptional
10.8%
Taiwanese
99.9
/100
|
#47
Exceptional
10.8%
Soviet Union
99.9
/100
|
#48
Exceptional
10.9%
Vietnamese
99.9
/100
|
#49
Exceptional
10.9%
Immigrants from Saudi Arabia
99.9
/100
|
#50
Exceptional
10.9%
Peruvians
99.8
/100
|
#51
Exceptional
10.9%

Immigrants from Japan Disability Correlation Summary

MeasurementImmigrants from Japan DataDisability Data
Minimum0.077%2.0%
Maximum52.8%51.5%
Range52.7%49.5%
Mean8.7%13.9%
Median5.0%10.2%
Interquartile 25% (IQ1)2.5%8.7%
Interquartile 75% (IQ3)9.3%14.9%
Interquartile Range (IQR)6.8%6.2%
Standard Deviation (Sample)11.0%10.5%
Standard Deviation (Population)10.9%10.3%

Correlation Details

Immigrants from Japan PercentileSample SizeDisability
[
0.0%
-
0.5%
]
0.077%
253,947,73012.2%
[
0.0%
-
0.5%
]
0.28%
53,809,32710.8%
[
0.5%
-
1.0%
]
0.51%
16,896,99010.2%
[
0.5%
-
1.0%
]
0.75%
5,440,2659.9%
[
0.5%
-
1.0%
]
0.95%
3,165,9119.3%
[
1.0%
-
1.5%
]
1.17%
1,529,8609.6%
[
1.0%
-
1.5%
]
1.40%
1,786,3138.7%
[
1.5%
-
2.0%
]
1.61%
825,0868.1%
[
1.5%
-
2.0%
]
1.84%
473,44711.0%
[
2.0%
-
2.5%
]
2.04%
260,98710.2%
[
2.0%
-
2.5%
]
2.27%
192,9138.3%
[
2.0%
-
2.5%
]
2.48%
96,6478.4%
[
2.5%
-
3.0%
]
2.75%
76,0038.7%
[
2.5%
-
3.0%
]
2.89%
179,93910.1%
[
3.0%
-
3.5%
]
3.14%
72,9779.0%
[
3.0%
-
3.5%
]
3.36%
709,01910.9%
[
3.5%
-
4.0%
]
3.55%
168,5339.6%
[
3.5%
-
4.0%
]
3.87%
30,3056.9%
[
3.5%
-
4.0%
]
3.92%
34,8799.0%
[
4.0%
-
4.5%
]
4.22%
76,2309.2%
[
4.0%
-
4.5%
]
4.36%
4,3336.2%
[
4.5%
-
5.0%
]
4.63%
30,69714.3%
[
4.5%
-
5.0%
]
4.74%
202,9039.9%
[
5.0%
-
5.5%
]
5.01%
37,15110.3%
[
5.0%
-
5.5%
]
5.32%
13,7514.3%
[
5.0%
-
5.5%
]
5.48%
76720.6%
[
5.5%
-
6.0%
]
5.69%
70314.9%
[
5.5%
-
6.0%
]
5.89%
54314.0%
[
6.0%
-
6.5%
]
6.09%
46018.3%
[
6.0%
-
6.5%
]
6.24%
4816.4%
[
6.5%
-
7.0%
]
6.66%
7,2802.0%
[
7.0%
-
7.5%
]
7.02%
41310.2%
[
7.5%
-
8.0%
]
7.59%
44,15212.1%
[
8.5%
-
9.0%
]
8.62%
34827.6%
[
9.0%
-
9.5%
]
9.00%
10016.0%
[
9.0%
-
9.5%
]
9.33%
1,0184.8%
[
9.5%
-
10.0%
]
9.84%
6129.5%
[
9.5%
-
10.0%
]
9.98%
27,37311.5%
[
11.0%
-
11.5%
]
11.21%
6966.9%
[
12.0%
-
12.5%
]
12.23%
32719.0%
[
15.0%
-
15.5%
]
15.27%
1,69037.9%
[
20.5%
-
21.0%
]
20.88%
9134.1%
[
28.5%
-
29.0%
]
28.53%
36846.5%
[
31.5%
-
32.0%
]
31.63%
33251.5%
[
34.0%
-
34.5%
]
34.23%
22218.5%
[
37.5%
-
38.0%
]
37.70%
1836.0%
[
52.5%
-
53.0%
]
52.78%
14410.4%