Immigrants from Japan 3 or more Vehicles in Household

COMPARE

Immigrants from Japan
Race
Ancestry
AfghanAfricanAlaska NativeAlaskan AthabascanAlbanianAleutAlsatianAmericanApacheArabArapahoArgentineanArmenianAssyrian/Chaldean/SyriacAustralianAustrianBahamianBangladeshiBarbadianBasqueBelgianBelizeanBermudanBhutaneseBlackfeetBolivianBrazilianBritishBritish West IndianBulgarianBurmeseCajunCambodianCanadianCape VerdeanCarpatho RusynCelticCentral AmericanCentral American IndianCherokeeCheyenneChickasawChileanChineseChippewaChoctawColombianColvilleComancheCosta RicanCreeCreekCroatianCrowCubanCypriotCzechCzechoslovakianDanishDelawareDominicanDutchDutch West IndianEastern EuropeanEcuadorianEgyptianEnglishEstonianEthiopianEuropeanFijianFilipinoFinnishFrenchFrench American IndianFrench CanadianGermanGerman RussianGhanaianGreekGuamanian/ChamorroGuatemalanGuyaneseHaitianHmongHonduranHopiHoumaHungarianIcelanderIndian (Asian)IndonesianInupiatIranianIraqiIrishIroquoisIsraeliItalianJamaicanJapaneseJordanianKenyanKiowaKoreanLaotianLatvianLebaneseLiberianLithuanianLumbeeLuxembourgerMacedonianMalaysianMalteseMarshalleseMenomineeMexicanMexican American IndianMongolianMoroccanNative HawaiianNavajoNepaleseNew ZealanderNicaraguanNigerianNorthern EuropeanNorwegianOkinawanOsageOttawaPaiutePakistaniPalestinianPanamanianParaguayanPennsylvania GermanPeruvianPimaPolishPortuguesePotawatomiPuebloPuerto RicanPuget Sound SalishRomanianRussianSalvadoranSamoanScandinavianScotch-IrishScottishSeminoleSenegaleseSerbianShoshoneSierra LeoneanSiouxSlavicSlovakSloveneSomaliSouth AfricanSouth AmericanSouth American IndianSoviet UnionSpaniardSpanishSpanish AmericanSpanish American IndianSri LankanSubsaharan AfricanSudaneseSwedishSwissSyrianTaiwaneseThaiTlingit-HaidaTohono O'OdhamTonganTrinidadian and TobagonianTsimshianTurkishU.S. Virgin IslanderUgandanUkrainianUruguayanUteVenezuelanVietnameseWelshWest IndianYakamaYaquiYugoslavianYumanYup'ikZimbabwean
Immigration
NonimmigrantsImmigrantsAfghanistanAfricaAlbaniaArgentinaArmeniaAsiaAustraliaAustriaBahamasBangladeshBarbadosBelarusBelgiumBelizeBoliviaBosnia and HerzegovinaBrazilBulgariaBurma/MyanmarCabo VerdeCambodiaCameroonCanadaCaribbeanCentral AmericaChileChinaColombiaCongoCosta RicaCroatiaCubaCzechoslovakiaDenmarkDominicaDominican RepublicEastern AfricaEastern AsiaEastern EuropeEcuadorEgyptEl SalvadorEnglandEritreaEthiopiaEuropeFijiFranceGermanyGhanaGreeceGrenadaGuatemalaGuyanaHaitiHondurasHong KongHungaryIndiaIndonesiaIranIraqIrelandIsraelItalyJamaicaJapanJordanKazakhstanKenyaKoreaKuwaitLaosLatin AmericaLatviaLebanonLiberiaLithuaniaMalaysiaMexicoMicronesiaMiddle AfricaMoldovaMoroccoNepalNetherlandsNicaraguaNigeriaNorth AmericaNorth MacedoniaNorthern AfricaNorthern EuropeNorwayOceaniaPakistanPanamaPeruPhilippinesPolandPortugalRomaniaRussiaSaudi ArabiaScotlandSenegalSerbiaSierra LeoneSingaporeSomaliaSouth AfricaSouth AmericaSouth Central AsiaSouth Eastern AsiaSouthern EuropeSpainSri LankaSt. Vincent and the GrenadinesSudanSwedenSwitzerlandSyriaTaiwanThailandTrinidad and TobagoTurkeyUgandaUkraineUruguayUzbekistanVenezuelaVietnamWest IndiesWestern AfricaWestern AsiaWestern EuropeYemenZaireZimbabweAzores
Select to Compare
Race
Ancestry
AfghanAfricanAlaska NativeAlaskan AthabascanAlbanianAleutAlsatianAmericanApacheArabArapahoArgentineanArmenianAssyrian/Chaldean/SyriacAustralianAustrianBahamianBangladeshiBarbadianBasqueBelgianBelizeanBermudanBhutaneseBlackfeetBolivianBrazilianBritishBritish West IndianBulgarianBurmeseCajunCambodianCanadianCape VerdeanCarpatho RusynCelticCentral AmericanCentral American IndianCherokeeCheyenneChickasawChileanChineseChippewaChoctawColombianColvilleComancheCosta RicanCreeCreekCroatianCrowCubanCypriotCzechCzechoslovakianDanishDelawareDominicanDutchDutch West IndianEastern EuropeanEcuadorianEgyptianEnglishEstonianEthiopianEuropeanFijianFilipinoFinnishFrenchFrench American IndianFrench CanadianGermanGerman RussianGhanaianGreekGuamanian/ChamorroGuatemalanGuyaneseHaitianHmongHonduranHopiHoumaHungarianIcelanderIndian (Asian)IndonesianInupiatIranianIraqiIrishIroquoisIsraeliItalianJamaicanJapaneseJordanianKenyanKiowaKoreanLaotianLatvianLebaneseLiberianLithuanianLumbeeLuxembourgerMacedonianMalaysianMalteseMarshalleseMenomineeMexicanMexican American IndianMongolianMoroccanNative HawaiianNavajoNepaleseNew ZealanderNicaraguanNigerianNorthern EuropeanNorwegianOkinawanOsageOttawaPaiutePakistaniPalestinianPanamanianParaguayanPennsylvania GermanPeruvianPimaPolishPortuguesePotawatomiPuebloPuerto RicanPuget Sound SalishRomanianRussianSalvadoranSamoanScandinavianScotch-IrishScottishSeminoleSenegaleseSerbianShoshoneSierra LeoneanSiouxSlavicSlovakSloveneSomaliSouth AfricanSouth AmericanSouth American IndianSoviet UnionSpaniardSpanishSpanish AmericanSpanish American IndianSri LankanSubsaharan AfricanSudaneseSwedishSwissSyrianTaiwaneseThaiTlingit-HaidaTohono O'OdhamTonganTrinidadian and TobagonianTsimshianTurkishU.S. Virgin IslanderUgandanUkrainianUruguayanUteVenezuelanVietnameseWelshWest IndianYakamaYaquiYugoslavianYumanYup'ikZimbabwean
Immigration
NonimmigrantsImmigrantsAfghanistanAfricaAlbaniaArgentinaArmeniaAsiaAustraliaAustriaBahamasBangladeshBarbadosBelarusBelgiumBelizeBoliviaBosnia and HerzegovinaBrazilBulgariaBurma/MyanmarCabo VerdeCambodiaCameroonCanadaCaribbeanCentral AmericaChileChinaColombiaCongoCosta RicaCroatiaCubaCzechoslovakiaDenmarkDominicaDominican RepublicEastern AfricaEastern AsiaEastern EuropeEcuadorEgyptEl SalvadorEnglandEritreaEthiopiaEuropeFijiFranceGermanyGhanaGreeceGrenadaGuatemalaGuyanaHaitiHondurasHong KongHungaryIndiaIndonesiaIranIraqIrelandIsraelItalyJamaicaJordanKazakhstanKenyaKoreaKuwaitLaosLatin AmericaLatviaLebanonLiberiaLithuaniaMalaysiaMexicoMicronesiaMiddle AfricaMoldovaMoroccoNepalNetherlandsNicaraguaNigeriaNorth AmericaNorth MacedoniaNorthern AfricaNorthern EuropeNorwayOceaniaPakistanPanamaPeruPhilippinesPolandPortugalRomaniaRussiaSaudi ArabiaScotlandSenegalSerbiaSierra LeoneSingaporeSomaliaSouth AfricaSouth AmericaSouth Central AsiaSouth Eastern AsiaSouthern EuropeSpainSri LankaSt. Vincent and the GrenadinesSudanSwedenSwitzerlandSyriaTaiwanThailandTrinidad and TobagoTurkeyUgandaUkraineUruguayUzbekistanVenezuelaVietnamWest IndiesWestern AfricaWestern AsiaWestern EuropeYemenZaireZimbabweAzores
3 or more Vehicles in Household
Income
Poverty
Unemployment
Labor Participation
Family Structure
Vehicle Availability
Education Level
Disability

Immigrants from Japan 3 or more Vehicles in Household
Fair

19.0%
3+ VEHICLES AVAILABLE
22.0/ 100
METRIC RATING
197th/ 347
METRIC RANK

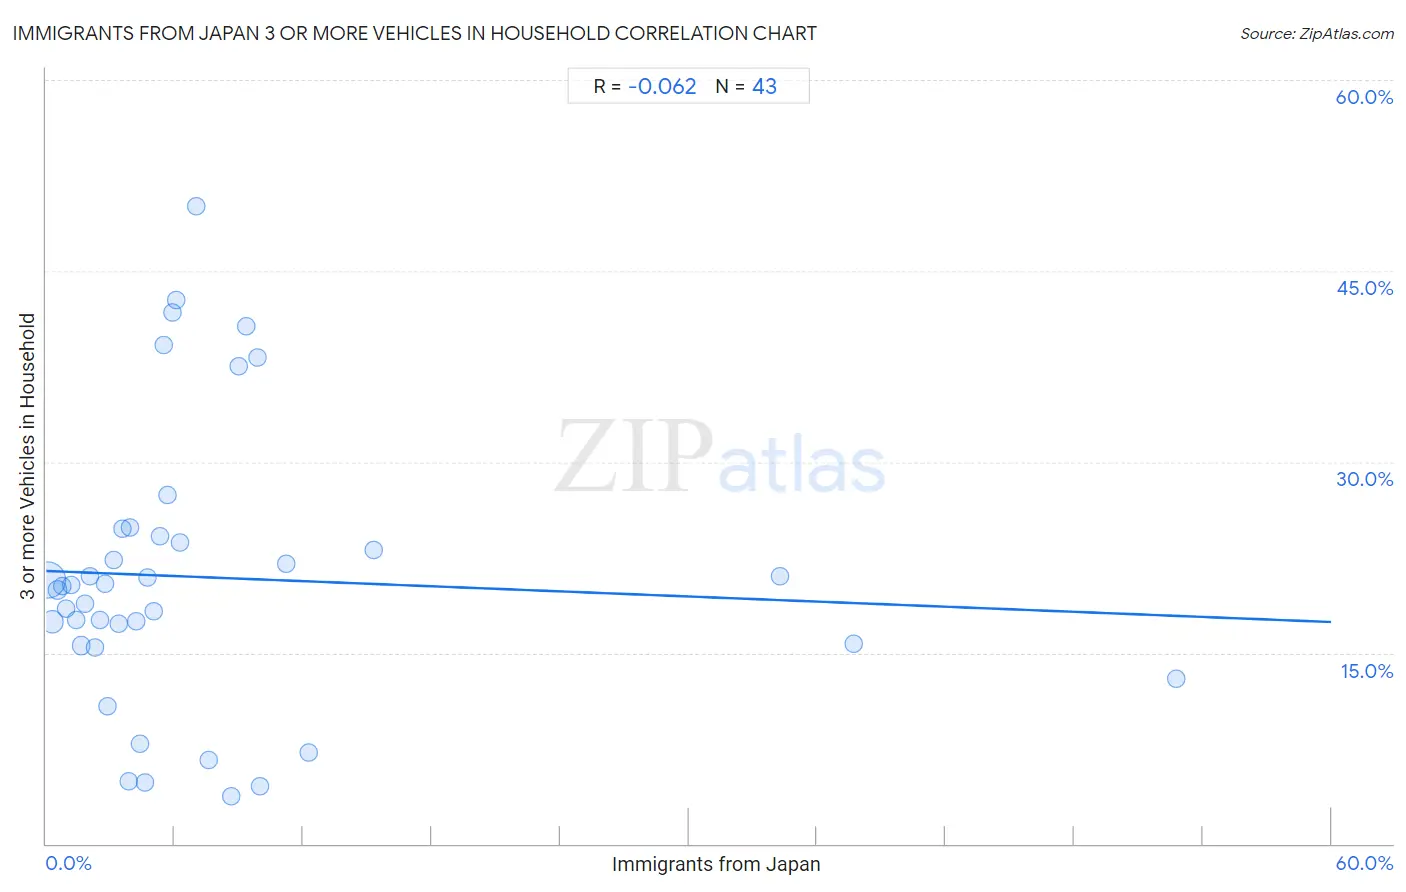
Immigrants from Japan 3 or more Vehicles in Household Correlation Chart

The statistical analysis conducted on geographies consisting of 339,875,755 people shows a slight negative correlation between the proportion of Immigrants from Japan and percentage of households with 3 or more vehicles available in the United States with a correlation coefficient (R) of -0.062 and weighted average of 19.0%. On average, for every 1% (one percent) increase in Immigrants from Japan within a typical geography, there is a decrease of 0.067% in percentage of households with 3 or more vehicles available.
Immigrants from Japan 3 or more Vehicles in Household
It is essential to understand that the correlation between the percentage of Immigrants from Japan and percentage of households with 3 or more vehicles available does not imply a direct cause-and-effect relationship. It remains uncertain whether the presence of Immigrants from Japan influences an upward or downward trend in the level of percentage of households with 3 or more vehicles available within an area, or if Immigrants from Japan simply ended up residing in those areas with higher or lower levels of percentage of households with 3 or more vehicles available due to other factors.

Demographics Similar to Immigrants from Japan by 3 or more Vehicles in Household

In terms of 3 or more vehicles in household, the demographic groups most similar to Immigrants from Japan are Central American Indian (19.0%, a difference of 0.030%), Immigrants from Moldova (19.1%, a difference of 0.18%), Serbian (19.1%, a difference of 0.22%), Tsimshian (19.1%, a difference of 0.26%), and Kenyan (19.1%, a difference of 0.30%).
DemographicsRating | Rank3 or more Vehicles in Household
Immigrants from Zimbabwe
25.5
/100
|
#190
Fair
19.1%
South American Indians
25.4
/100
|
#191
Fair
19.1%
Kenyans
24.7
/100
|
#192
Fair
19.1%
Tsimshian
24.4
/100
|
#193
Fair
19.1%
Serbians
24.0
/100
|
#194
Fair
19.1%
Immigrants from Moldova
23.6
/100
|
#195
Fair
19.1%
Central American Indians
22.2
/100
|
#196
Fair
19.0%
Immigrants from Japan
22.0
/100
|
#197
Fair
19.0%
Egyptians
19.5
/100
|
#198
Poor
19.0%
Immigrants from Norway
19.0
/100
|
#199
Poor
19.0%
Argentineans
18.2
/100
|
#200
Poor
18.9%
Arabs
17.7
/100
|
#201
Poor
18.9%
Immigrants from Austria
15.4
/100
|
#202
Poor
18.9%
Tohono O'odham
14.8
/100
|
#203
Poor
18.9%
Immigrants from Romania
14.6
/100
|
#204
Poor
18.9%

Immigrants from Japan 3 or more Vehicles in Household Correlation Summary

MeasurementImmigrants from Japan Data3 or more Vehicles in Household Data
Minimum0.077%3.8%
Maximum52.8%50.1%
Range52.7%46.3%
Mean7.5%20.9%
Median4.6%20.3%
Interquartile 25% (IQ1)2.3%15.6%
Interquartile 75% (IQ3)8.6%24.2%
Interquartile Range (IQR)6.3%8.6%
Standard Deviation (Sample)10.3%11.0%
Standard Deviation (Population)10.2%10.9%

Correlation Details

Immigrants from Japan PercentileSample Size3 or more Vehicles in Household
[
0.0%
-
0.5%
]
0.077%
253,826,29620.7%
[
0.0%
-
0.5%
]
0.28%
53,746,30017.4%
[
0.5%
-
1.0%
]
0.51%
16,868,30419.9%
[
0.5%
-
1.0%
]
0.75%
5,432,12620.3%
[
0.5%
-
1.0%
]
0.95%
3,155,12818.5%
[
1.0%
-
1.5%
]
1.17%
1,524,53820.4%
[
1.0%
-
1.5%
]
1.40%
1,777,64017.6%
[
1.5%
-
2.0%
]
1.61%
818,82715.6%
[
1.5%
-
2.0%
]
1.84%
470,84218.8%
[
2.0%
-
2.5%
]
2.04%
255,48021.0%
[
2.0%
-
2.5%
]
2.27%
192,89615.5%
[
2.0%
-
2.5%
]
2.48%
95,68917.6%
[
2.5%
-
3.0%
]
2.75%
76,00320.4%
[
2.5%
-
3.0%
]
2.89%
179,93910.8%
[
3.0%
-
3.5%
]
3.14%
71,19222.3%
[
3.0%
-
3.5%
]
3.36%
709,01917.3%
[
3.5%
-
4.0%
]
3.55%
168,53324.7%
[
3.5%
-
4.0%
]
3.87%
30,3054.9%
[
3.5%
-
4.0%
]
3.92%
34,87924.8%
[
4.0%
-
4.5%
]
4.22%
75,18217.5%
[
4.0%
-
4.5%
]
4.36%
4,3337.9%
[
4.5%
-
5.0%
]
4.63%
30,6974.8%
[
4.5%
-
5.0%
]
4.74%
202,90320.9%
[
5.0%
-
5.5%
]
5.01%
37,15118.3%
[
5.0%
-
5.5%
]
5.32%
13,75124.2%
[
5.0%
-
5.5%
]
5.48%
49339.2%
[
5.5%
-
6.0%
]
5.69%
70327.4%
[
5.5%
-
6.0%
]
5.89%
54341.7%
[
6.0%
-
6.5%
]
6.09%
46042.7%
[
6.0%
-
6.5%
]
6.24%
48123.7%
[
7.0%
-
7.5%
]
7.02%
41350.1%
[
7.5%
-
8.0%
]
7.59%
42,8286.6%
[
8.5%
-
9.0%
]
8.62%
3483.8%
[
9.0%
-
9.5%
]
9.00%
10037.5%
[
9.0%
-
9.5%
]
9.36%
73740.7%
[
9.5%
-
10.0%
]
9.84%
6138.2%
[
9.5%
-
10.0%
]
9.98%
27,3734.5%
[
11.0%
-
11.5%
]
11.21%
69622.0%
[
12.0%
-
12.5%
]
12.23%
3277.2%
[
15.0%
-
15.5%
]
15.27%
1,69023.1%
[
34.0%
-
34.5%
]
34.23%
22221.0%
[
37.5%
-
38.0%
]
37.70%
18315.7%
[
52.5%
-
53.0%
]
52.78%
14413.0%